![[MOTOGP – RESULTS] : Who did best within each team and each factory in 2025](https://virageduraccordement.com/wp-content/uploads/2025/12/54833282836_7c4a07bc5e_o.jpg?w=1024)
introduction
After going into details about everyone’s performance in 2025 here, now it’s time to focus on what happened between riders who had the same bike, aka teammates and riders from the same factory.
The order followed in this article is first the factory standings, and then, within each factory, the teams standings.
on the tables
The « % of the season completed » corresponds to the number of starts taken (accounting for both sprints and races) amongst the 44 starts available in 2025.
H2H = Head to Head, amount of times a rider did better than his teammate in a qualifying session / sprint / race.
on the charts
Each qualifying/sprints/races differences chart shows the number of positions between the two riders, the number appearing in the color of the rider on top. A lack of number means that either :
- one of the rider didn’t participate in the session/race,
- one of the rider DNFed.
For better visibility / reading experience, all charts can be enhanced if you click on them (at least on computer).
For the factories H2H, a point is attributed for all the sprints and races, even if only one rider from the factory might have finished a sprint or a race.
ducati
ducati lenovo team
main data
| – | Marc Marquez | Pecco Bagnaia |
|---|---|---|
| average qualifying position | 2.0 | 6.0 |
| qualifying h2h | 13 | 5 |
| average sprint finishing position | 1.5 | 8.1 |
| sprints h2h | 14 | 1 |
| average race finishing position | 2.0 | 4.2 |
| races h2h | 12 | 2 |
| % of the season completed | 82% | 100% |
| dnfs | 3 | 7 |
| championship points | 545 | 288 |
| championship finish | P1 | P5 |
The season might have started with some hope that Pecco Bagnaia could, if not truly challenge Marc Marquez for the championship, at least battle with him and offer a fight in most races. After a handful of rounds, though, it became clear that it simply couldn’t be the case.
The Spaniard dominated the Italian in pretty much every aspect, the gap between them growing over the season, as evidenced by the charts below.
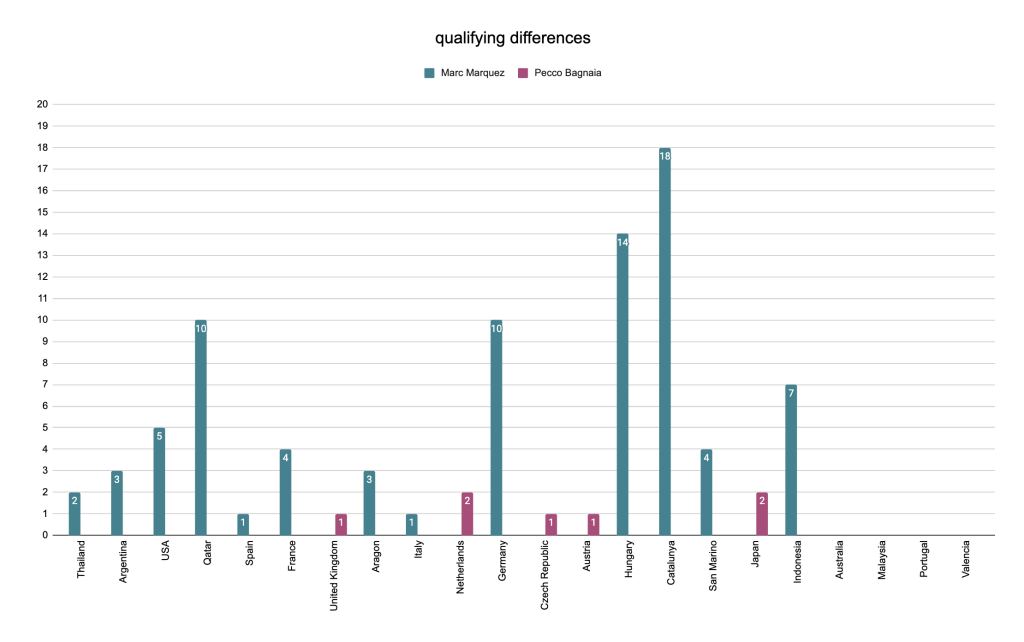
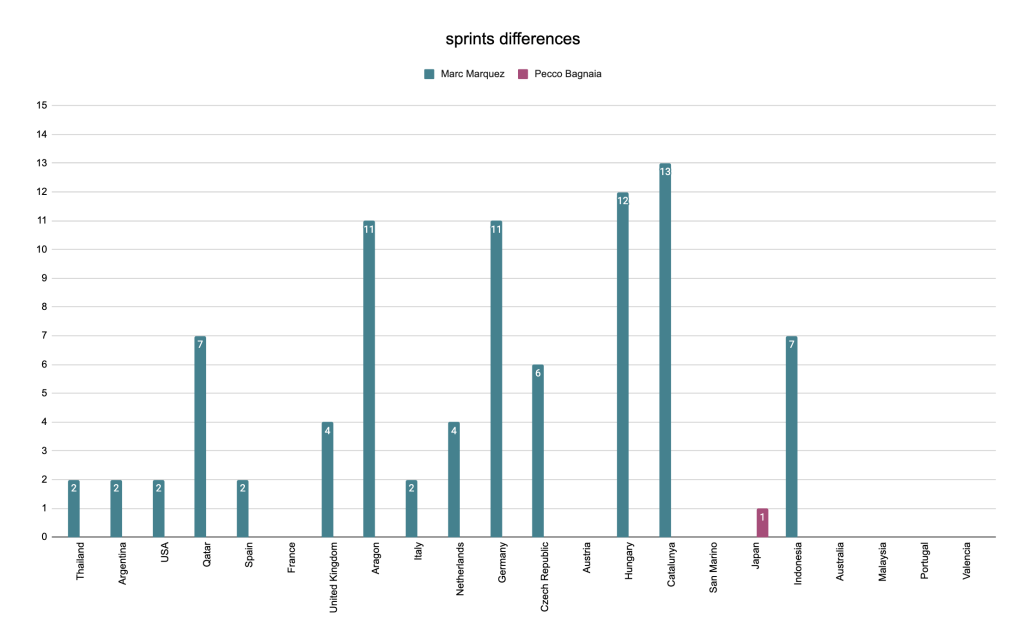
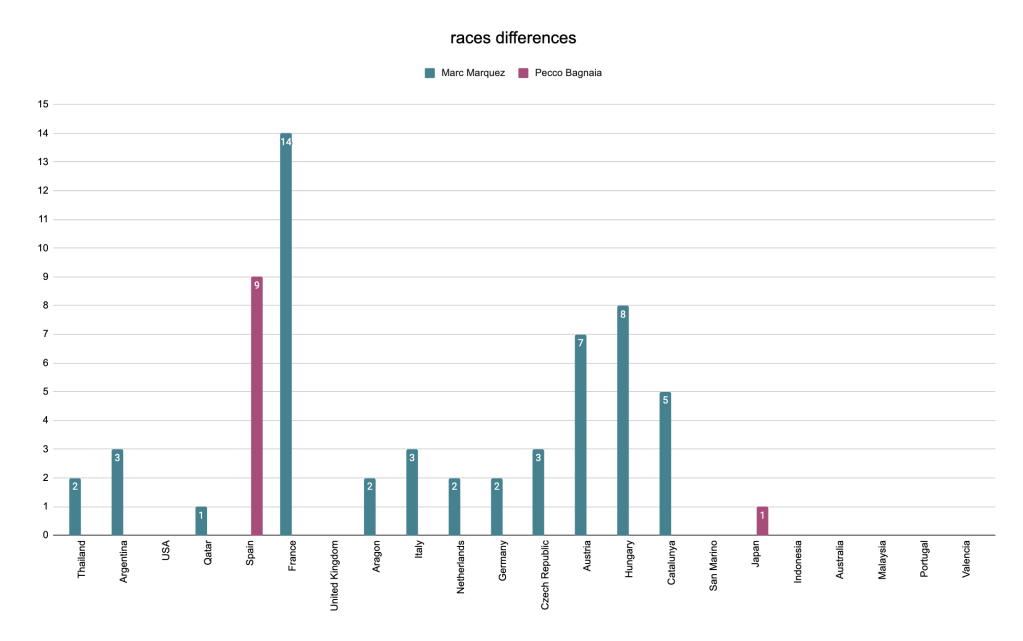
positions differences
| Session | Marc Marquez | Pecco Bagnaia |
|---|---|---|
| qualifying | 6.3 | 1.4 |
| sprints | 6.1 | 1.0 |
| races | 4.3 | 5.0 |
Pecco Bagnaia did out-qualify Marc Marquez on 5 occasions (for his 3 poles, the P3 in Silverstone and the P2 in Assen) but when he did so, Marc wasn’t qualifying far behind, only 1.4 positions away on average.
On the contrary, when Marc was out-qualifying his teammate, the difference was much bigger, which serves to explain the difference in their average qualifying position (Marc with an average P2 and Pecco with an average P6).
Racing wise, there were barely any crumbs left for the Italian who only got the upper hand on 3 occasions : the Jerez race (+9 following a Marc crash after which he remounted), the Motegi sprint and race (+1, the Ducati riders getting the 1-2).
bk8 gresini racing motogp
main data
| – | Alex Marquez | Fermin Aldeguer |
|---|---|---|
| average qualifying position | 3.9 | 9.5 |
| qualifying h2h | 20 | 2 |
| average sprint finishing position | 3.8 | 8.3 |
| sprints h2h | 17 | 3 |
| average race finishing position | 3.9 | 8.4 |
| races h2h | 12 | 4 |
| % of the season completed | 100% | 100% |
| dnfs | 4 | 6 |
| championship points | 467 | 214 |
| championship finish | P2 | P8 |
We could expect the comparison between the runner-up of the championship and a rookie to be complicated for the latest but to be quite honest, I think Fermin Aldeguer still held his own and in the end, they’re not the teammates with the biggest gaps.
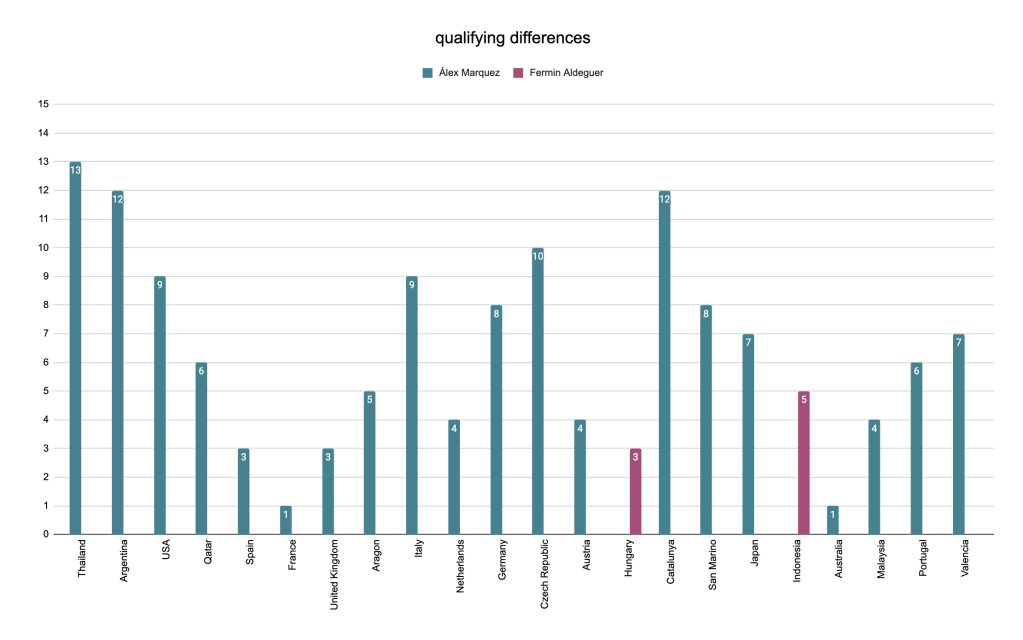
positions differences
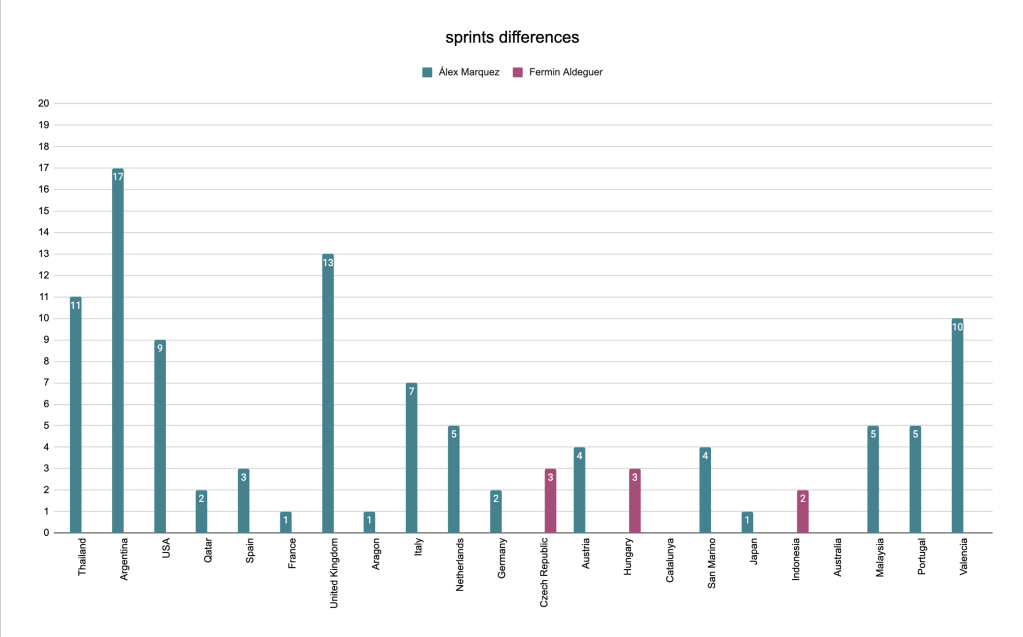
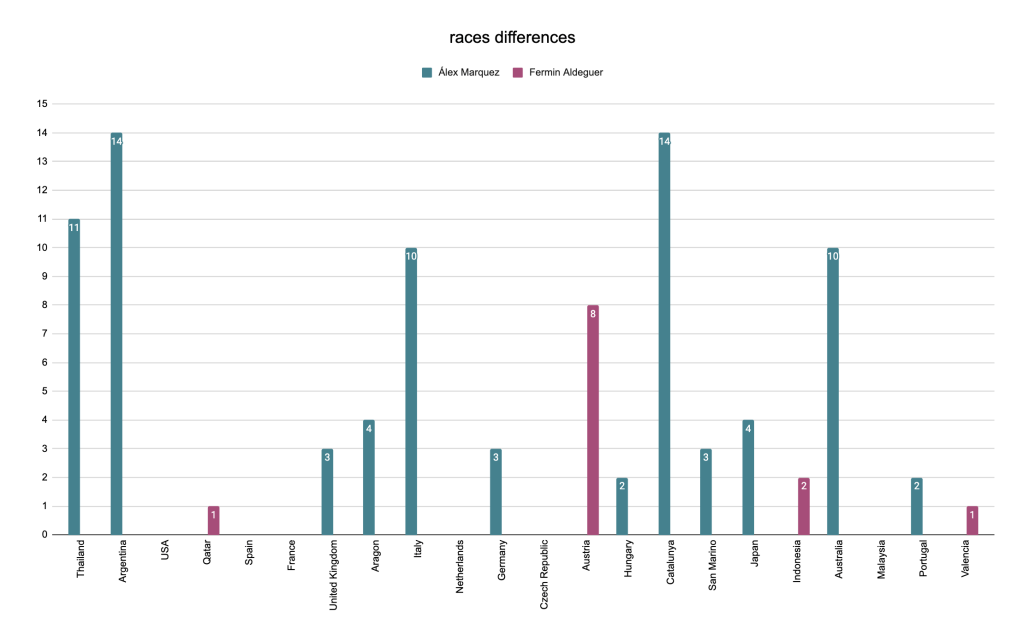
| Session | Alex Marquez | Fermin Aldeguer |
|---|---|---|
| qualifying | 6.6 | 4.0 |
| sprints | 5.9 | 2.7 |
| races | 6.7 | 3.0 |
Unsurprisingly, when the younger rider was beating the older one, it wasn’t by much. The gaps stayed between 1 and 3 positions except in two occasions :
- Race in Spielberg with a +8 (a podium for Fermin in P2 while Alex finished an unusually low P10),
- Qualifying in Mandalika with a +5 (Fermin’s only front row of the season in P2 while Alex qualified P7).
pertamina enduro vr46 racing team
main data
| – | Fabio Di Giannantonio | Franco Morbidelli |
|---|---|---|
| average qualifying position | 8.5 | 7.1 |
| qualifying h2h | 8 | 13 |
| average sprint finishing position | 5.5 | 7.1 |
| sprints h2h | 12 | 6 |
| average race finishing position | 7.9 | 6.5 |
| races h2h | 5 | 10 |
| % of the season completed | 100% | 93% |
| dnfs | 5 | 5 |
| championship points | 262 | 231 |
| championship finish | P6 | P7 |
Fabio Di Giannantonio and Franco Morbidelli are the two teammates with the closest data points amongst all the grid. With Saturday mornings and Sundays in favor of one of them (Morbidelli) and Saturday afternoon in favor of the other (Di Giannantonio), they finished close in the standings and close in points (especially when you consider the one sprint and two races that Franco Morbidelli didn’t take part of due to his Sachsenring sprint injury).
positions differences
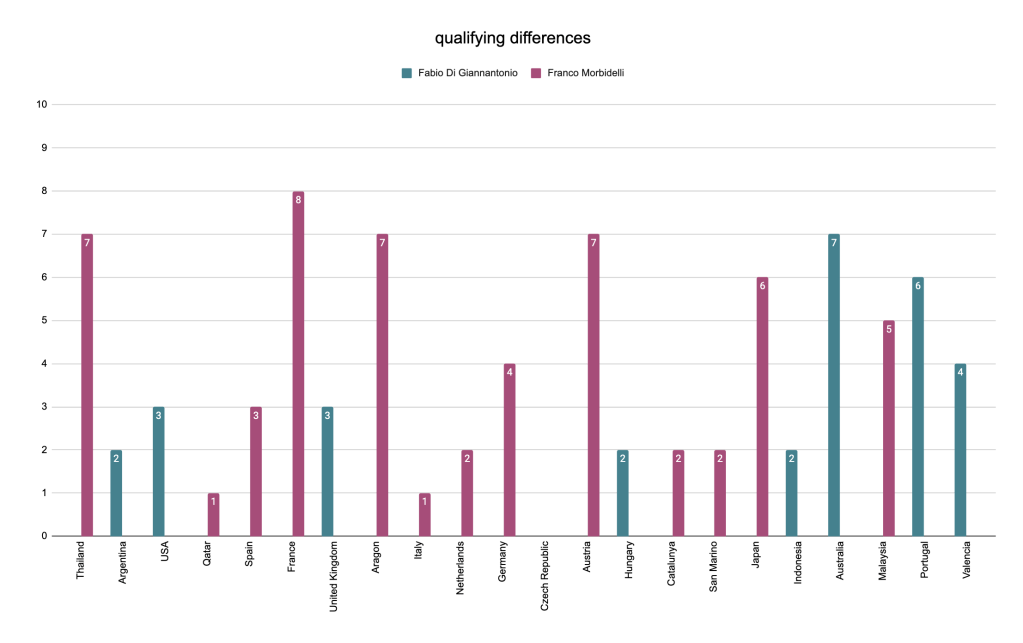
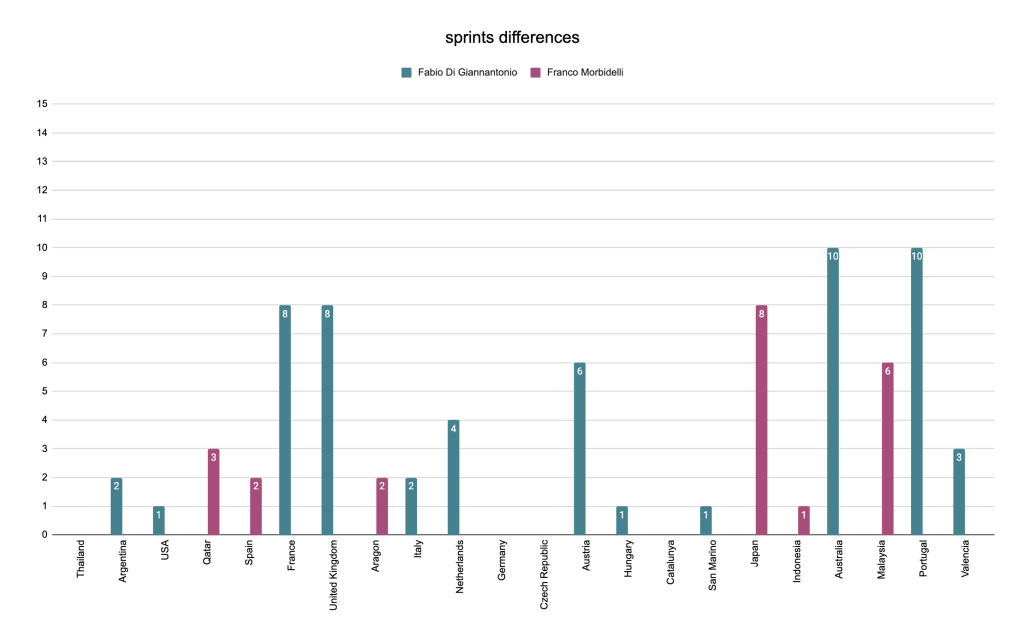
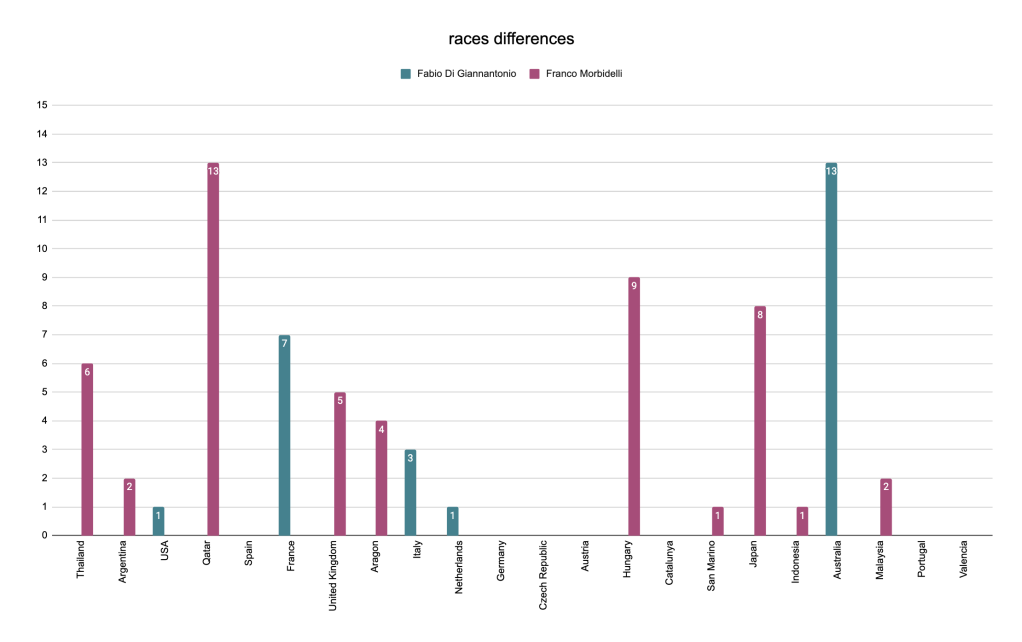
| Session | Fabio Di Giannantonio | Franco Morbidelli |
|---|---|---|
| qualifying | 3.6 | 4.2 |
| sprints | 4.7 | 3.7 |
| races | 5.0 | 5.1 |
For riders who ended the season with quite similar results, the two Italians rarely qualified or finished races close to each other, finishing races 6 or more positions apart in 7 sprints and 6 races.
They did share 15 Q2 sessions and the only Q2 session without a VR46 bike was Brno (Morbidelli absent, Di Giannantonio qualifying P13).
all teams
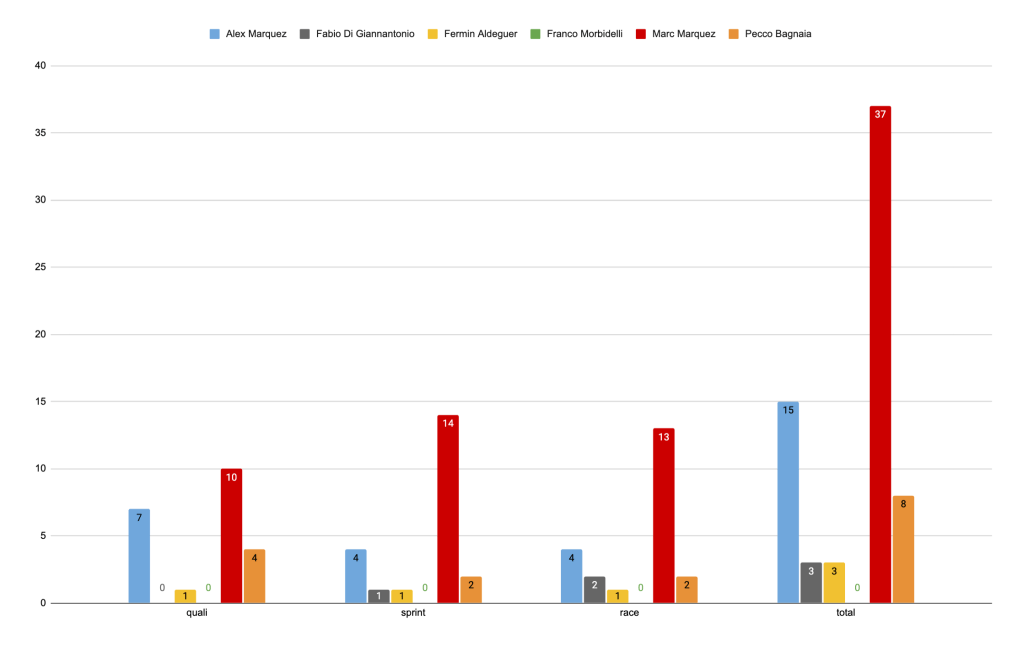
H2H – All Ducati riders
Except for Franco Morbidelli, all Ducati riders were the best Ducati in at least 3 qualifying sessions / sprints / races. That being said, Marc Marquez heavily dominated the rest of the Ducatis (especially when we remember he only competed in 18 of the 22 rounds).
Here is what happens if we remove Marc from the equation :
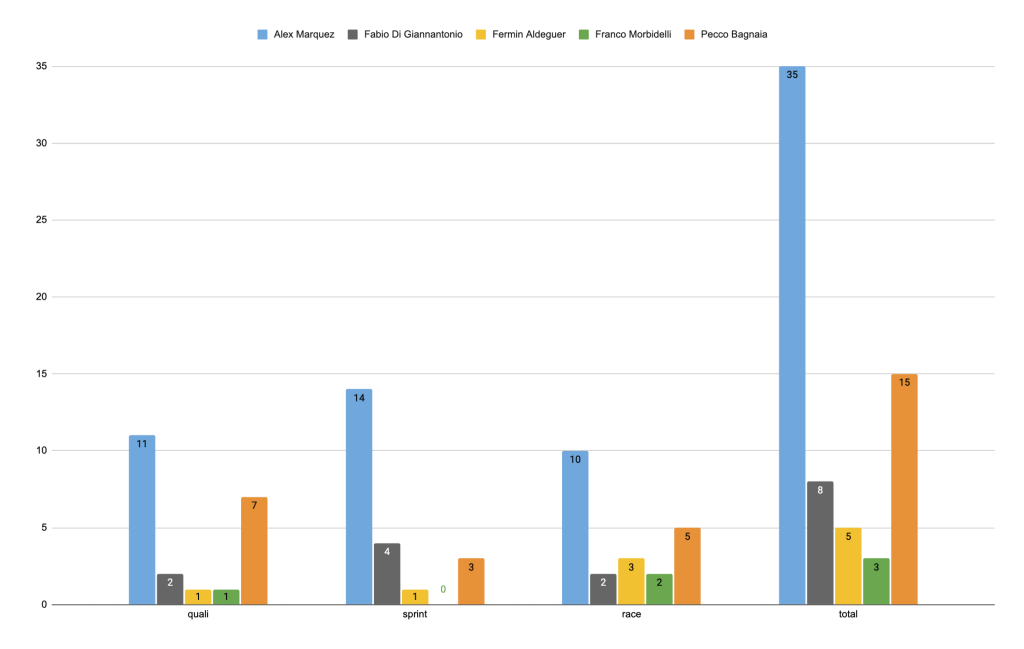
H2H – All Ducati riders except Marc Marquez
Alex Marquez is just as dominant as his brother being on top more than 50% of the time (on 36 out of 66 occasions). This time, though, Franco Morbidelli manages to be the best Ducati (outside of Marc) a couple of times.
Finally, if we also remove Alex Marquez :
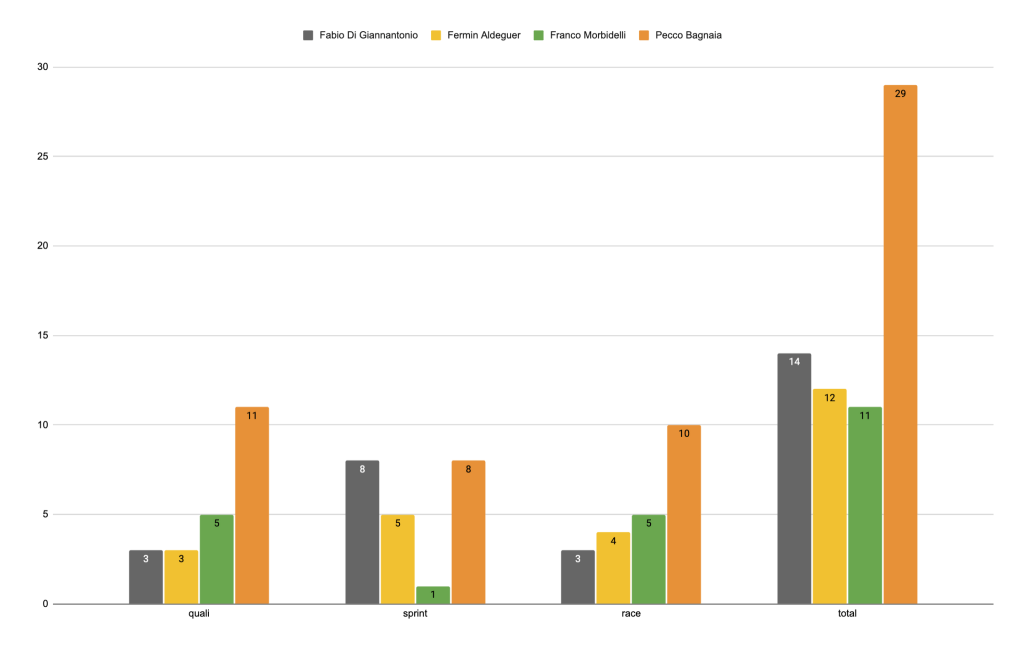
H2H – All Ducati riders except Marc Marquez and Alex Marquez
There, Pecco Bagnaia comes out on top with a little under half of the best results (44%) but then, the repartition of the rest is pretty even between Fabio Di Giannantonio, Fermin Aldeguer and Franco Morbidelli.
aprilia
aprilia racing
main data
| – | Jorge Martin | Marco Bezzecchi |
|---|---|---|
| average qualifying position | 15.0 | 7.2 |
| qualifying h2h | 0 | 8 |
| average sprint finishing position | 12.8 | 5.9 |
| sprints h2h | 0 | 6 |
| average race finishing position | 8.5 | 5.3 |
| races h2h | 0 | 3 |
| % of the season completed | 34% | 100% |
| dnfs | 5 | 6 |
| championship points | 24 | 353 |
| championship finish | P21 | P3 |
The two factory Aprilia riders couldn’t have lived through more different 2025 seasons. While Jorge Martin was expected to lead the Aprilia development with his world champion status, he spent most of the season injured and Marco Bezzecchi ended up in that leader role and eventually achieved a P3 in the standings that not many people must have predicted for him before the season started.
It’s undeniable that Marco Bezzecchi did incredibly well with an improving Aprilia and that Jorge Martin wasn’t healthy long enough to prove his potential on that bike. Watching these two and how they perform next to one another in 2026 will definitely be proving interesting.
positions differences
| Session | Jorge Martin | Marco Bezzecchi |
|---|---|---|
| qualifying | – | 9.6 |
| sprints | – | 7.8 |
| races | – | 5.7 |
Obviously, we don’t have many data points to use to begin with (only 8 qualifying sessions, 6 sprints and 3 races they both finished) but in any case, the Spaniard never finished higher than his teammate and usually, he would qualify or finish a sprint / race much behind the Italian.
trackhouse motogp team
main data
| – | Ai Ogura | Raul Fernandez |
|---|---|---|
| average qualifying position | 15.7 | 12.0 |
| qualifying h2h | 6 | 12 |
| average sprint finishing position | 12.2 | 10.7 |
| sprints h2h | 7 | 9 |
| average race finishing position | 10.2 | 9.1 |
| races h2h | 4 | 5 |
| % of the season completed | 84% | 95% |
| dnfs | 5 | 5 |
| championship points | 89 | 172 |
| championship finish | P16 | P10 |
Trackhouse is the perfect example of a team where the two riders had opposite trajectories throughout the season. The 2025 rookie started the season beautifully before getting injured and struggling more meanwhile the 2022 rookie didn’t have an amazing start but improved dramatically as we got closer to Valencia.
Indeed, when we look at their head-to-head numbers and the various data points (AQP, sprints AFP, races AFP), Ai Ogura isn’t straying that far from Raul Fernandez and he had good results to show for himself in those first rounds of the season. In the end, though, the Spaniard picked up more speed and the podiums (including his first MotoGP win) helped him get away in the standings (nearly getting twice as much points as the Japanese in the end).
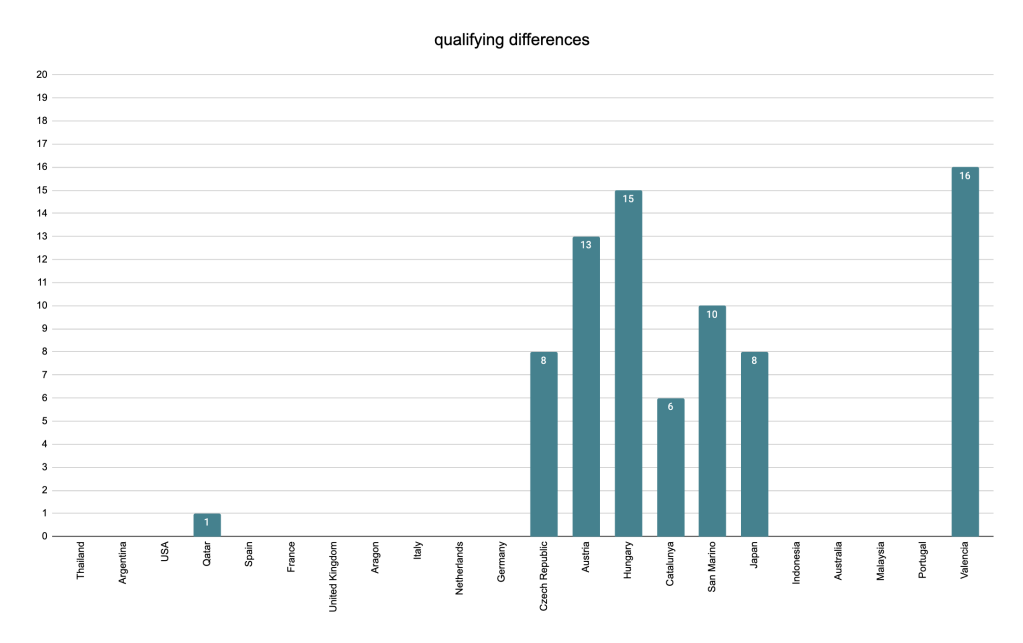
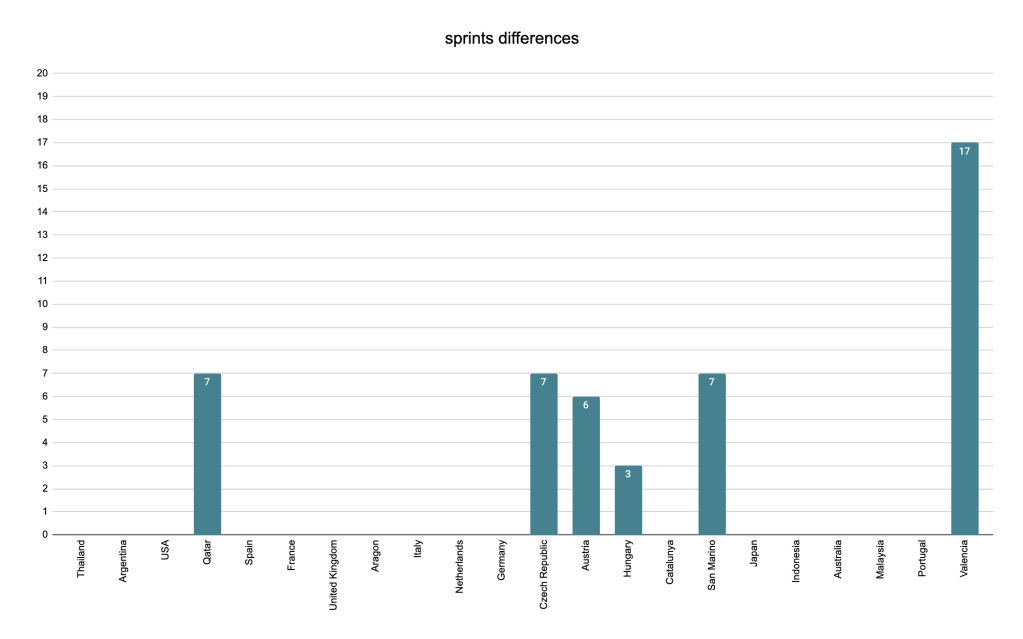
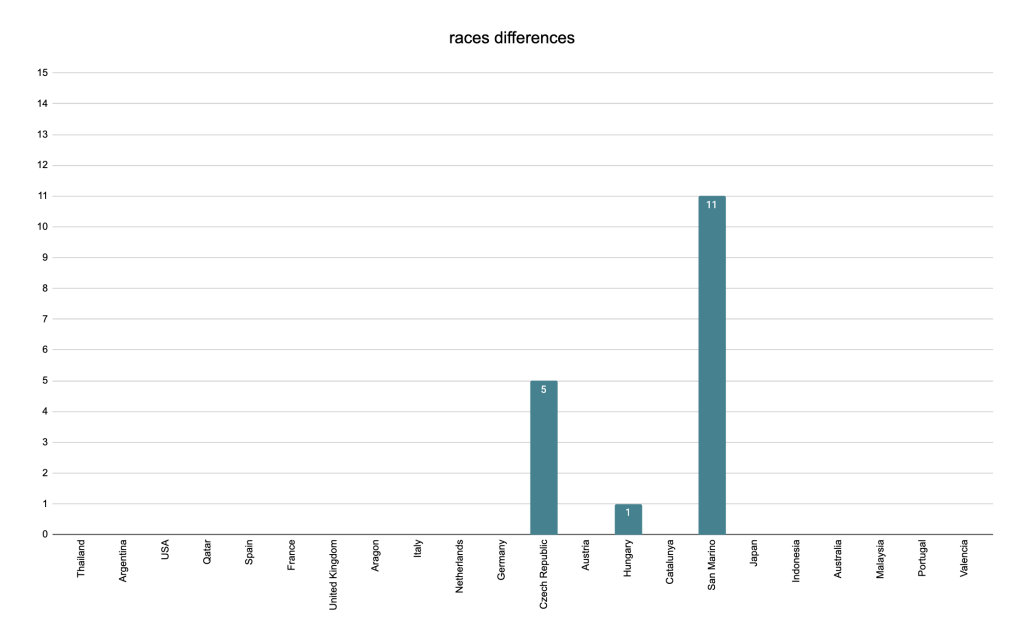
positions differences
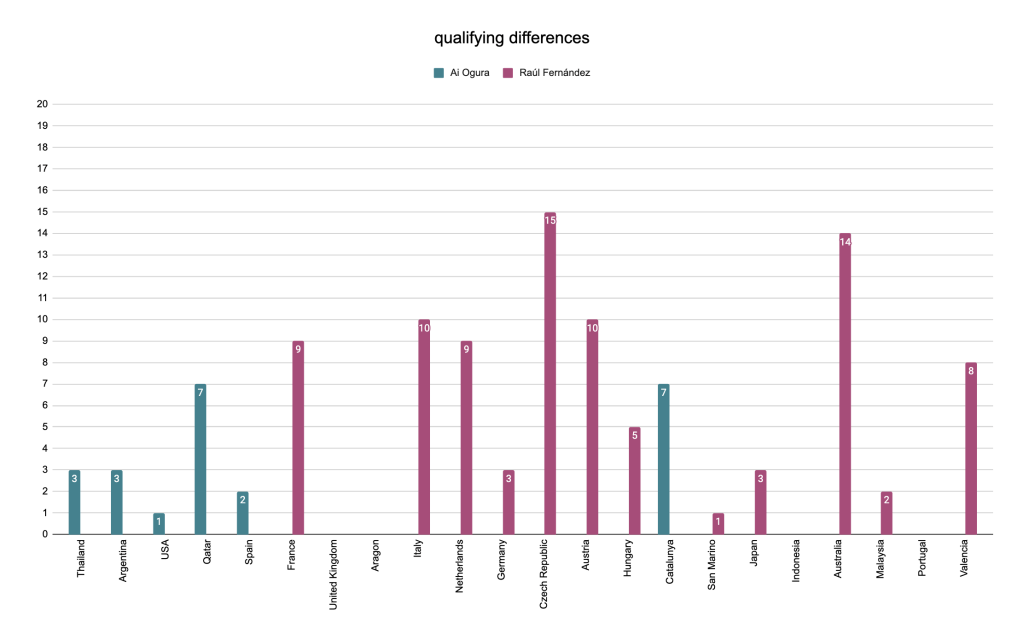
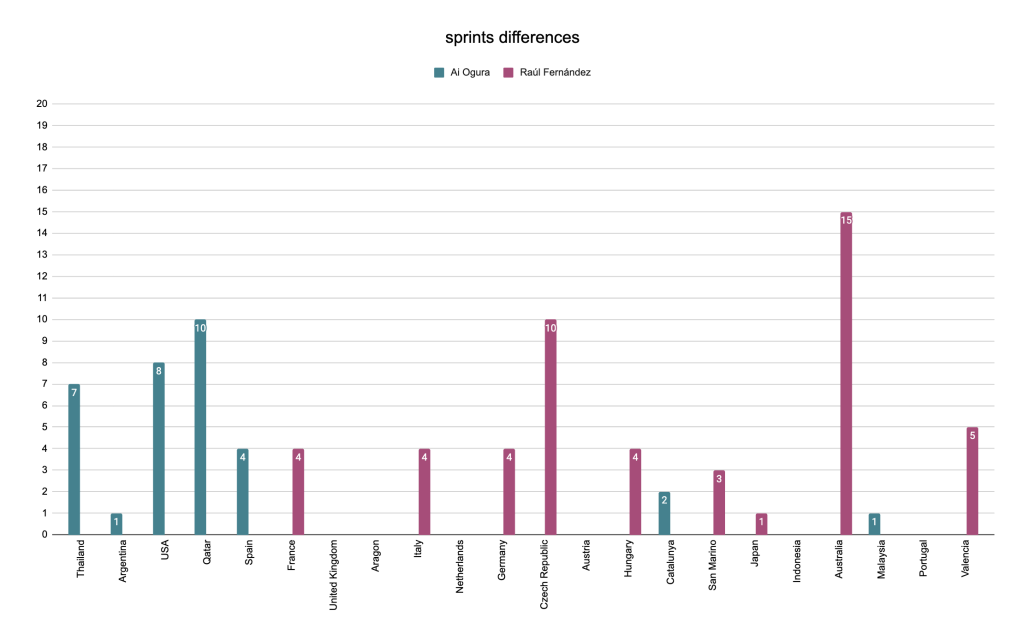
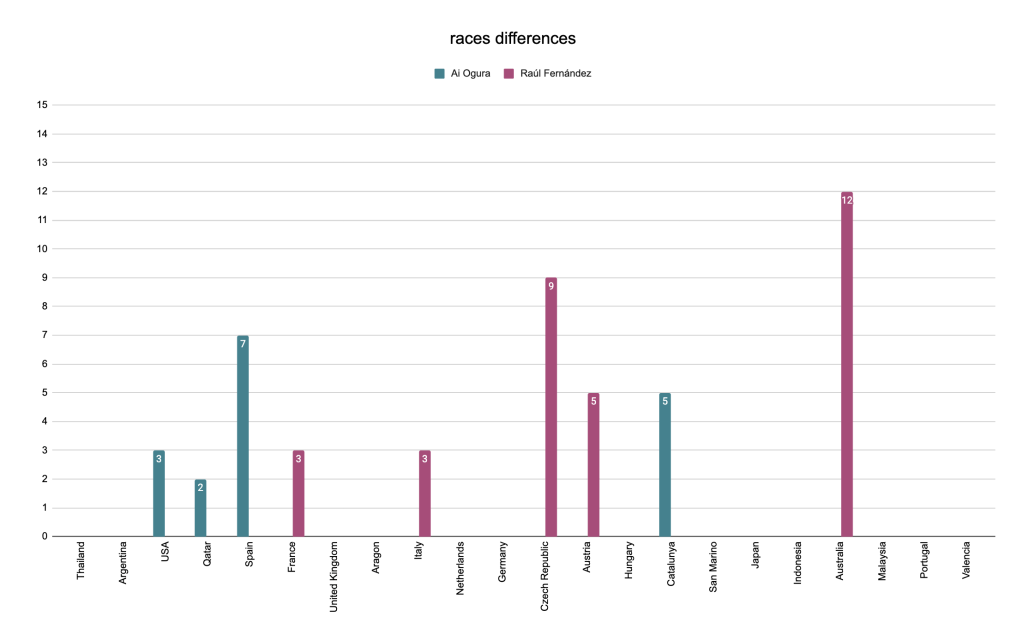
| Session | Ai Ogura | Raul Fernandez |
|---|---|---|
| qualifying | 3.8 | 7.4 |
| sprints | 4.7 | 5.6 |
| races | 4.3 | 6.4 |
As evidenced before, you can see in the charts how Ai Ogura was only ahead of his teammate in the first part of the season. After Jerez (round 5), he only manage to outdo him on a couple of occasions :
- The whole weekend in Barcelona (+7 in qualifying turning into a +2 in the sprint and +5 in the race),
- The sprint in Sepang (P12 finish for Ai, P13 finish for Raul).
Also, when Raul was finishing ahead, the gaps to his teammate were bigger (around 6 or 7 positions on average) than the other way around (around 4 to 5).
all teams
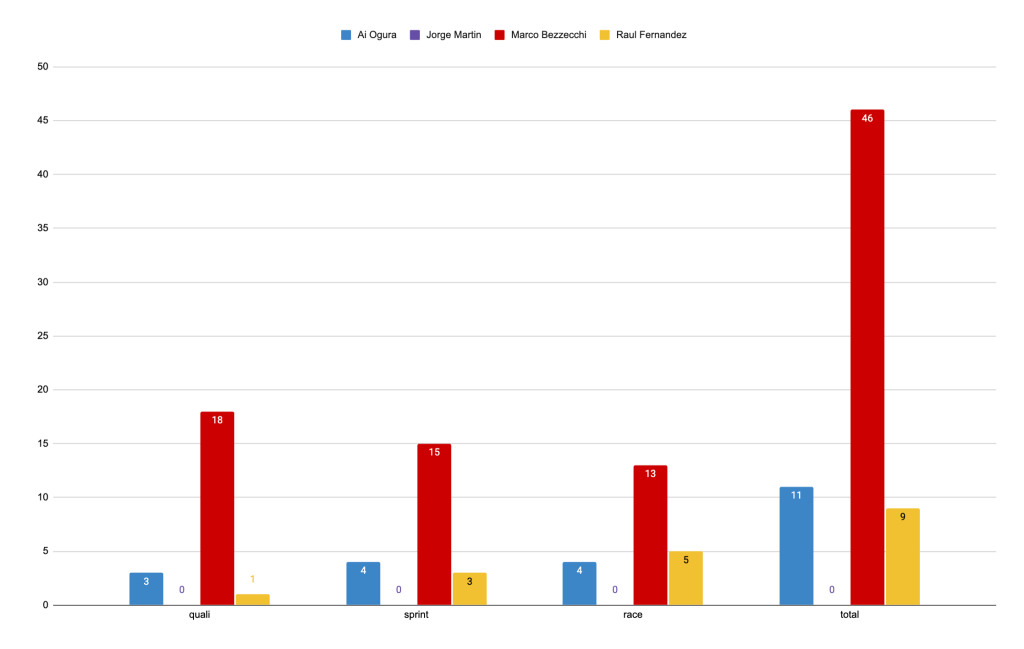
H2H – All Aprilia riders
Similarly to Marc Marquez with Ducati, Marco Bezzecchi dominated the other Aprilias, getting the best qualifying/sprint/race result 70% of the time. The rest of the time, the split was pretty even between Ai Ogura and Raul Fernandez.
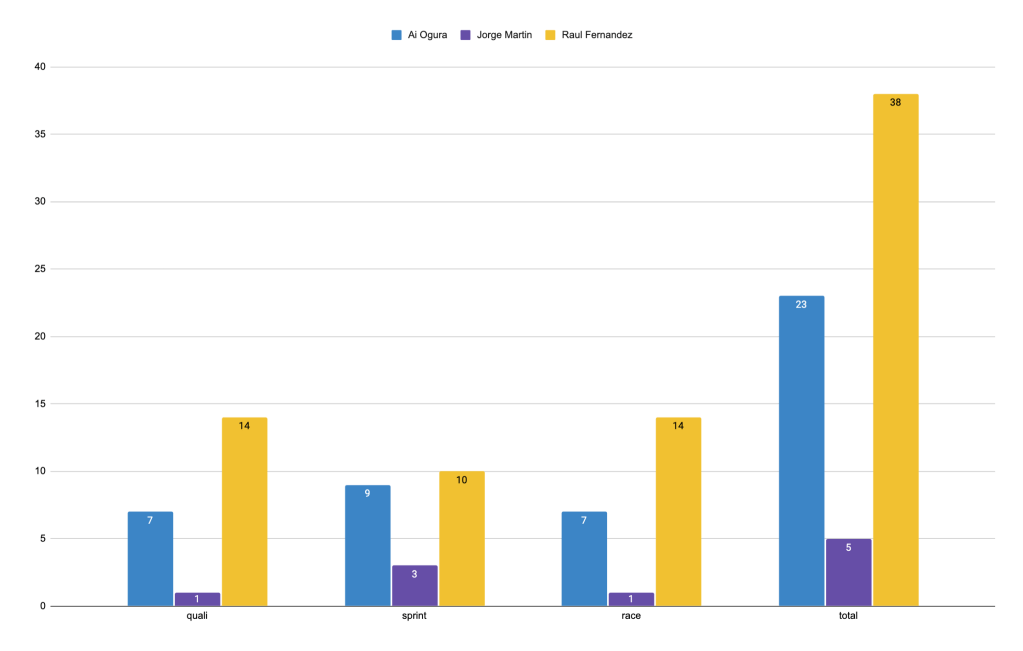
H2H – All Aprilia riders except Marco Bezzecchi
When we take away Marco Bezzecchi’s results, though, Jorge Martin manages to exist in a couple of occasions and Raul Fernandez takes the lead more often than Ai Ogura (about 50% of the time).
ktm
red bull ktm factory racing
main data
| – | Brad Binder | Pedro Acosta |
|---|---|---|
| average qualifying position | 14.3 | 7.0 |
| qualifying h2h | 0 | 22 |
| average sprint finishing position | 10.3 | 6.9 |
| sprints h2h | 1 | 14 |
| average race finishing position | 8.5 | 6.0 |
| races h2h | 4 | 12 |
| % of the season completed | 100% | 100% |
| dnfs | 10 | 5 |
| championship points | 155 | 307 |
| championship finish | P11 | P4 |
KTM is definitely one of the teams where the comparison hurts the guy that is not on top. If Brad Binder and Pedro Acosta had similar results in 2024 (Binder only finishing two points ahead of Acosta, respectively P5 and P6 in the standings), the Spaniard definitely crushed the South African when getting his factory seat in 2025.
Despite the couple of mistakes that Acosta made, it didn’t prevent him from getting half the DNFs of Binder and double the points, 7 positions separating them in the standings at the end of the season.
positions differences
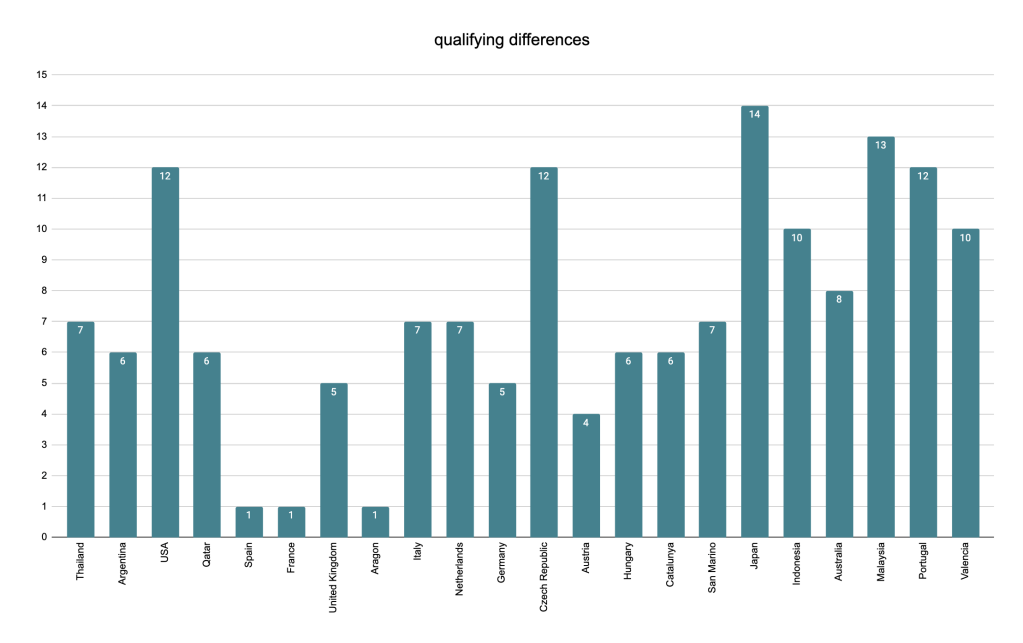
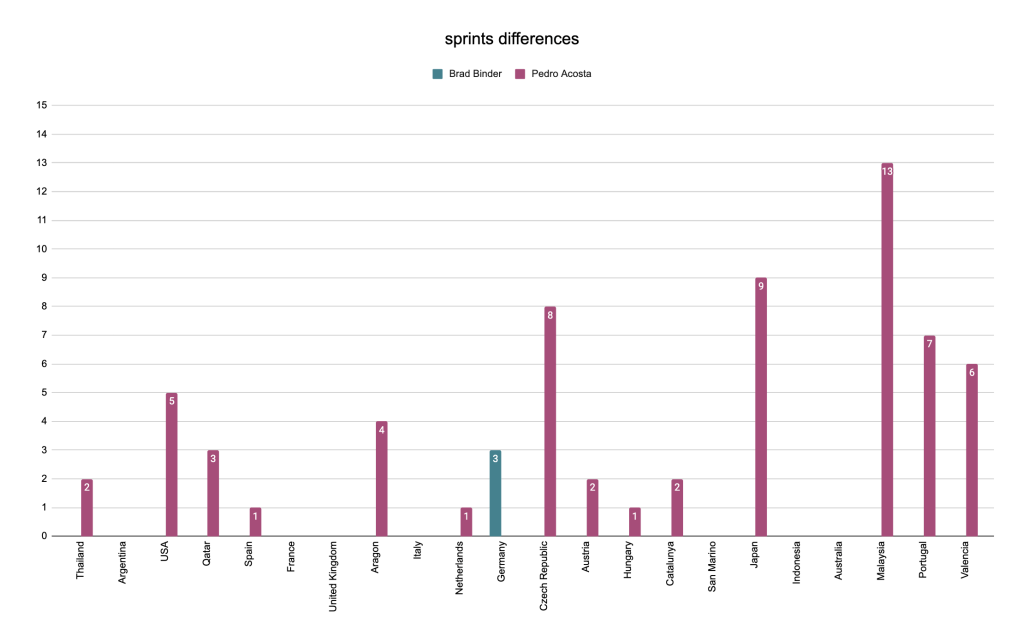
| Session | Brad Binder | Pedro Acosta |
|---|---|---|
| qualifying | – | 7.3 |
| sprints | 3.0 | 4.6 |
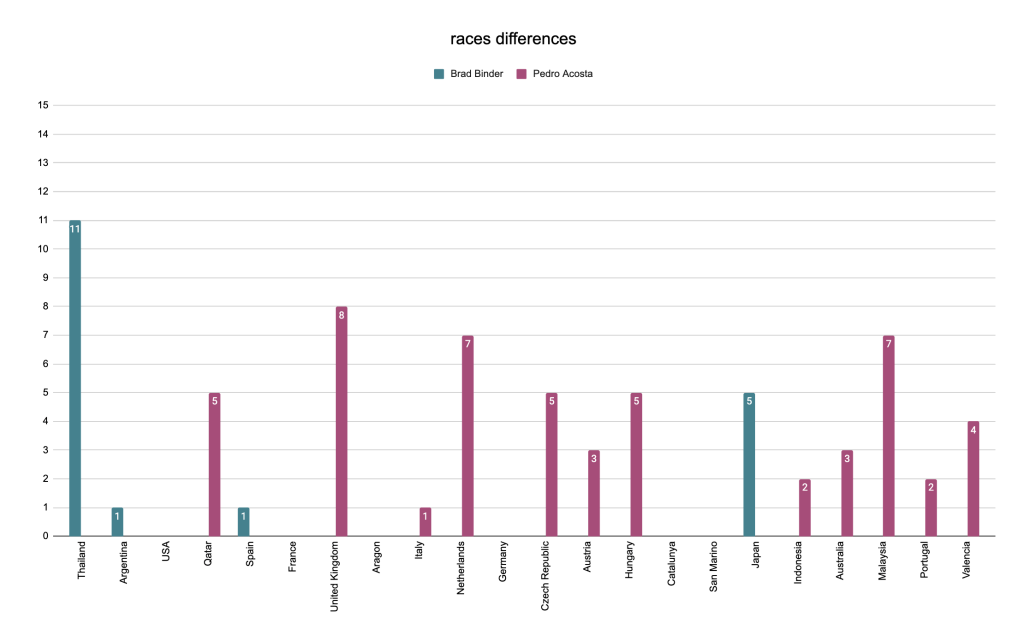
| races | 4.5 | 4.3 |
Brad Binder never beat his teammate in qualifying and he only finished ahead of him in a sprint once (Sachsenring, P6 and P9). Races wise, the South African won the head-to-head on 4 occasions :
- Buriram (round 1) : +11 – Pedro crashed out and rejoined the race,
- Termas (round 2) : +1,
- Jerez (round 5) : +1,
- Motegi (round 17) : +5 – Pedro had tyre issues making him drop in pace.
red bull ktm tech3
main data
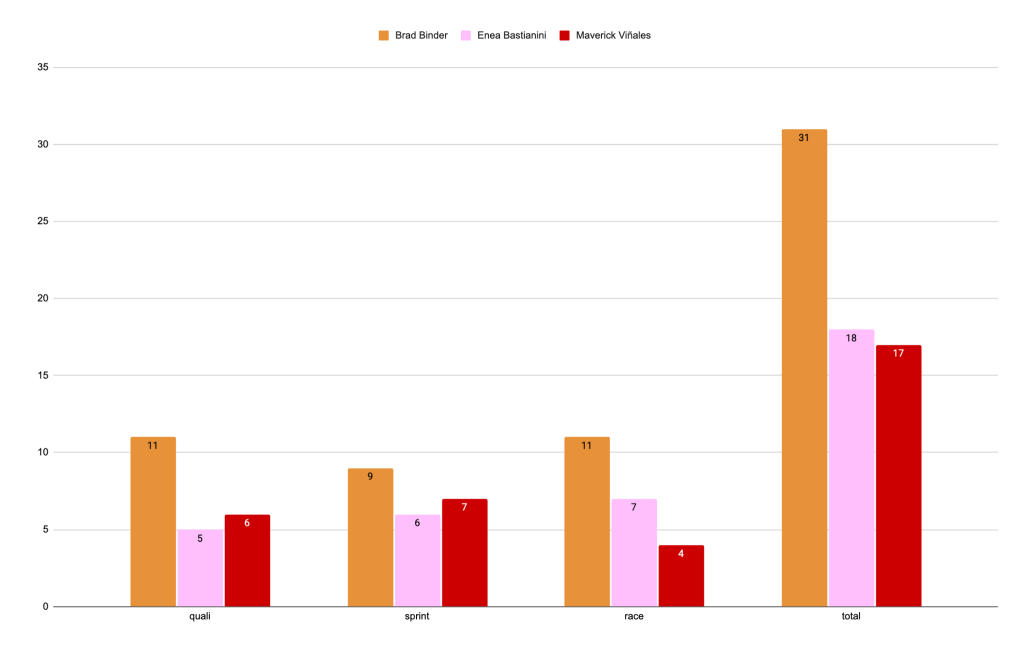
| – | Enea Bastianini | Maverick Viñales |
|---|---|---|
| average qualifying position | 16.3 | 14.2 |
| qualifying h2h | 6 | 10 |
| average sprint finishing position | 11.7 | 11.5 |
| sprints h2h | 4 | 8 |
| average race finishing position | 10.4 | 11.6 |
| races h2h | 6 | 5 |
| % of the season completed | 95% | 64% |
| dnfs | 8 | 4 |
| championship points | 112 | 72 |
| championship finish | P14 | P18 |
Much like Trackhouse, we can place Tech3 in the category of teams who had riders with different trajectories in 2025. Maverick Viñales started the season with promising results and then got injured and was never able to fully recover after the Sachsenring crash (round 11). On the other hand, Enea Bastianini had a very complicated first half but points of lights in the second half (including his podium in Barcelona).
All things considered, their average numbers stay fairly similar. The Italian finished the season with more points in the standings but if we take into account the % of races started, the Tech3 riders end up on a more even field (2.7 pt per race/sprint* started for Bastianini, 2.6 for Viñales).
*On a deeper study I would separate the points earned via sprints and those earned via races but it doesn’t really matter here. You can double the value and consider it the points earned per race weekend where both the sprint and the race were started if you prefer.
positions differences


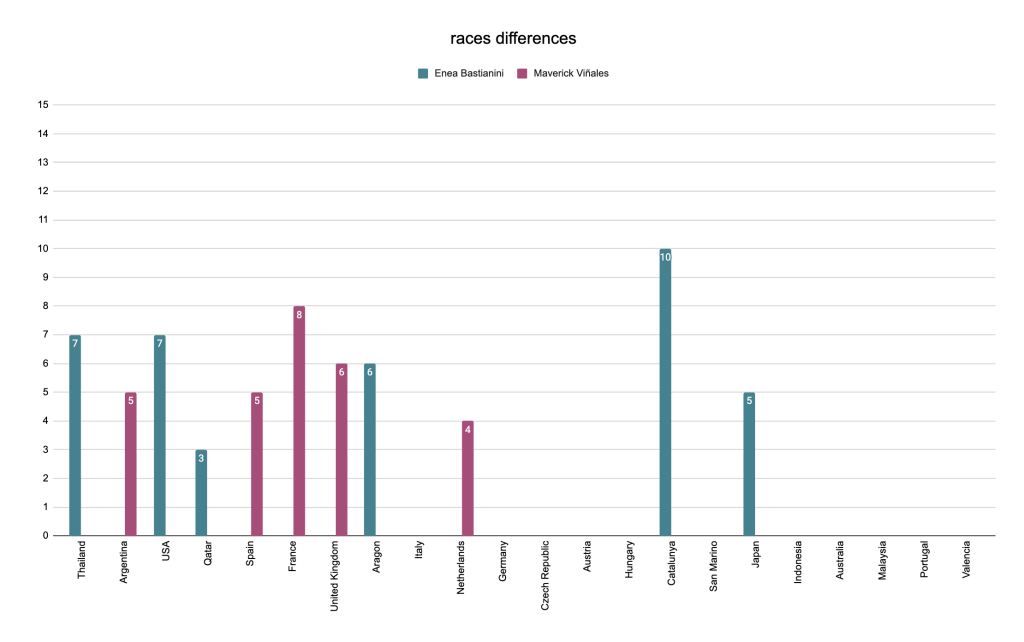
| Session | Enea Bastianini | Maverick Viñales |
|---|---|---|
| qualifying | 6.0 | 7.9 |
| sprints | 6.5 | 6.0 |
| races | 6.3 | 5.6 |
As mentioned earlier, with their different trajectories, Enea Bastianini and Maverick Viñales rarely performed the same on the same day. Across 16 qualifying sessions, 12 sprints and 11 races finished, the Tech3 teammates were only within 3 positions of each other on 10 occasions (26% of the time).
all teams

H2H – All KTM riders
Not to repeat myself but with KTM we are once again in the presence of a rider —in this case, Pedro Acosta— dominating the rest of the guys from the same factory and the others only having crumbs (well, exactly a third of sessions) to share.
H2H – All KTM riders except Pedro Acosta
If we remove Pedro Acosta, Brad Binder is the KTM rider with the upper hand about half of the time (47%) and then, Enea Bastianini (27%) and Maverick Viñales (26%) have an almost even split of the rest.
Considering how much of the season he missed (a third) and how much of it he ran injured, this highlights how well Maverick Viñales was doing on a new bike when he was healthy.
honda
honda hrc castrol
main data
| – | Joan Mir | Luca Marini |
|---|---|---|
| average qualifying position | 11.5 | 11.8 |
| qualifying h2h | 10 | 9 |
| average sprint finishing position | 10.4 | 11.1 |
| sprints h2h | 7 | 6 |
| average race finishing position | 8.2 | 9.1 |
| races h2h | 4 | 2 |
| % of the season completed | 95% | 86% |
| dnfs | 19 | 3 |
| championship points | 96 | 142 |
| championship finish | P15 | P13 |
For two riders who seem to have completely different approaches on how to handle that Honda (beyond the limit versus more carefully), the two Honda teammates sure have similar results to show off for themselves in 2025.
A couple of things do stand out, though. Luca Marini does not have any podium (contrary to Joan Mir and his P3s in Motegi and Sepang) but he still scored 48% more points than the Spaniard simply because he was crossing the finish line much more often (only 3 DNFs for Luca to Joan’s 19).
positions differences
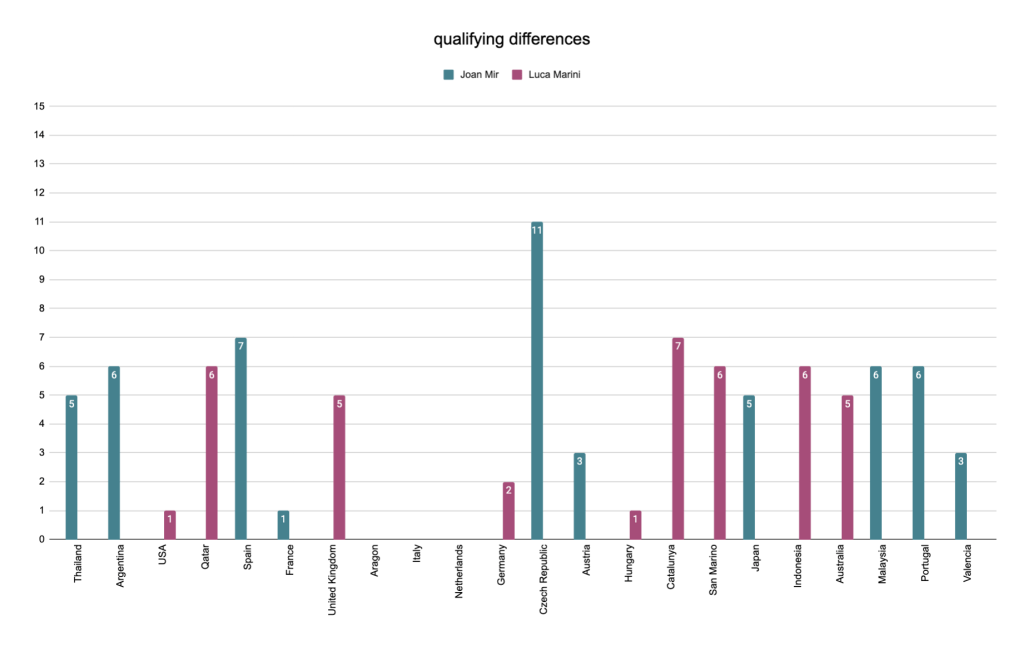
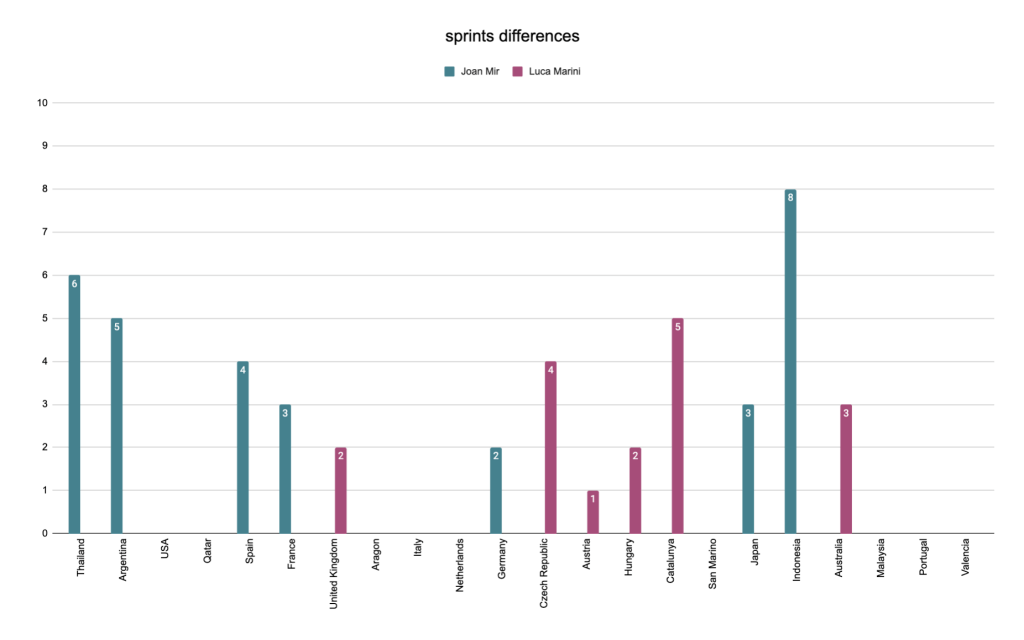
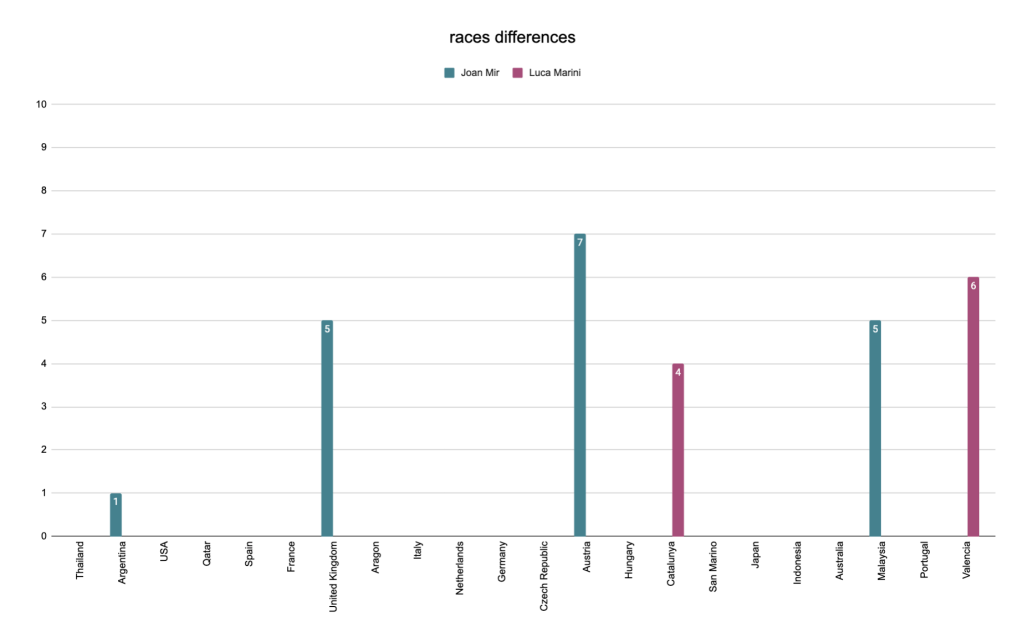
| Session | Joan Mir | Luca Marini |
|---|---|---|
| qualifying | 5.3 | 4.3 |
| sprints | 4.4 | 2.8 |
| races | 4.5 | 5.0 |
In qualifying, Joan Mir and Luca Marini were far apart more often than not (3 positions difference or less on 6 occasions, 5 positions or more on 13 occasions). With sprints, they tended to get a bit closer.
Their data points regarding Sunday races are fairly limited (mostly due to all of Joan’s DNFs and some because of the races Luca missed post Suzuka injury) and they only both crossed the same finish line on 6 occasions. Once they were one after the other (P9 and P10 in Termas) but the rest of the time 4 to 7 positions separated them.
comparison with 2024
In 2024, both riders had close data (averages, championship positions) and they both improved tremendously to finish 2025 with data similar to one another again. In a few words, they roughly improved the same amount (numbers wise).
The one noticeable difference is the following : in 2024, Joan had 50% more points than Luca (21 to 14) and this time, it’s Luca having 48% more points than Joan (142 to 96).
lcr honda
main data
| – | Johann Zarco | Somkiat Chantra |
|---|---|---|
| average qualifying position | 11.0 | 21.5 |
| qualifying h2h | 17 | 0 |
| average sprint finishing position | 9.2 | 18.9 |
| sprints h2h | 11 | 0 |
| average race finishing position | 9.7 | 16.4 |
| races h2h | 10 | 2 |
| % of the season completed | 100% | 77% |
| dnfs | 12 | 3 |
| championship points | 148 | 7 |
| championship finish | P12 | P26 |
If Fermin Aldeguer and Ai Ogura both manage to exist a bit next to their experimented teammate, it was not the came for Somkiat Chantra next to Johann Zarco.
Between a Johann Zarco finding more feeling with the Honda (like the factory riders, his results have vastly improved between 2024 and 2025) and a Somkiat Chantra who just couldn’t make much work in his rookie season on the Honda, the comparison at the end of the season has to end up looking really harsh, as evidenced by the numbers above.
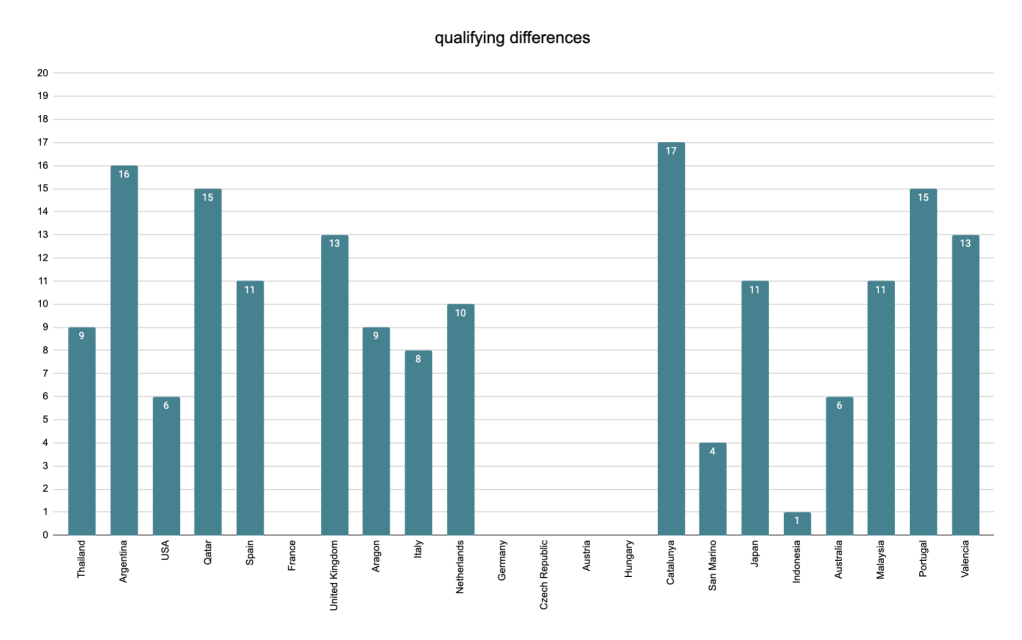
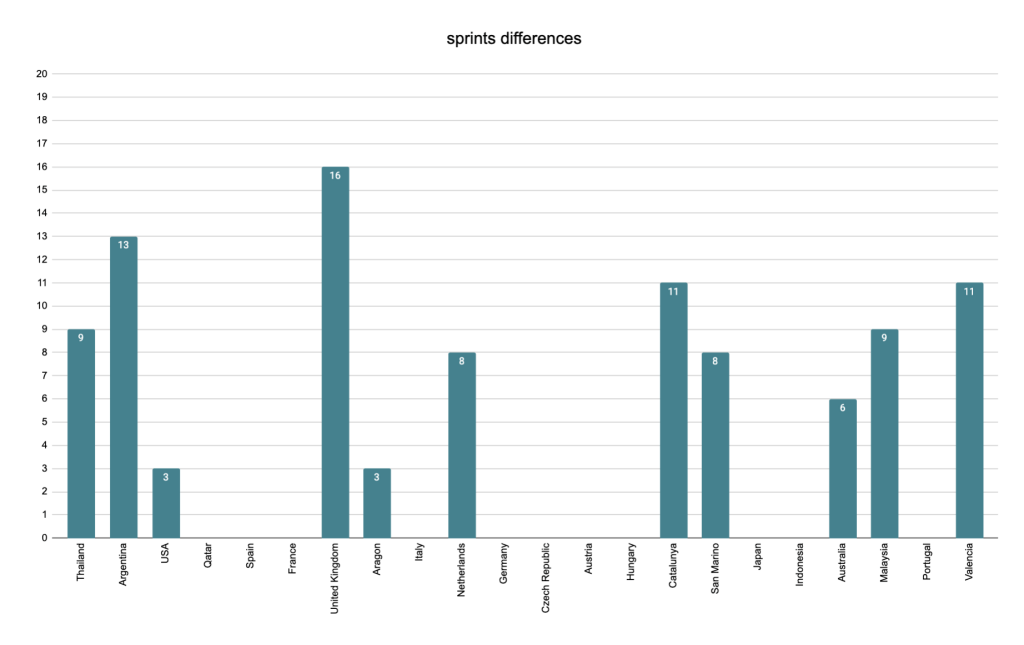
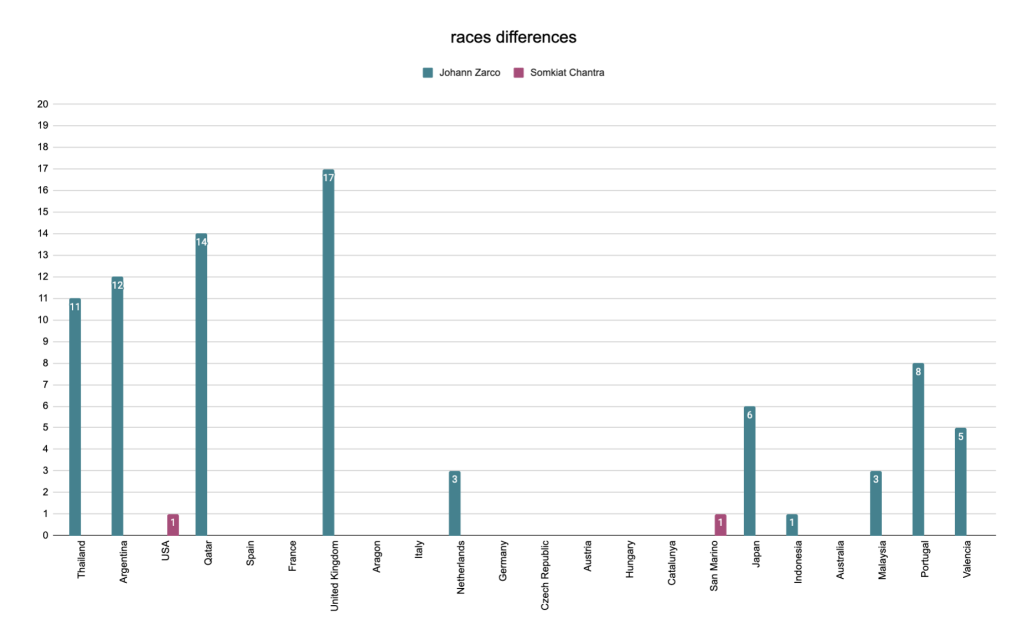
| Session | Johann Zarco | Somkiat Chantra |
|---|---|---|
| qualifying | 10.3 | – |
| sprints | 8.8 | – |
| races | 8.0 | 1.0 |
As evidenced by the differences in their AQP and AFPs, Johann Zarco was qualifying and finishing ahead of Somkiat Chantra by a lot of positions.
The two times Somkiat Chantra finished ahead, it was by one position :
- Race in COTA : P16 and P17,
- Race in Misano : P15 and P16.
all teams

H2H – All Honda riders
And finally Honda decides to be different by not having one leader / rider above the rest. Johann Zarco was definitely in that role last season (see the 2024 version of the article you’re reading right now) but in 2025, things were much more evenly split (Zarco still with an edge on the others).
Somkiat Chantra never managed to be the best Honda in any session but besides that, qualifying was pretty well split between the other 3 riders (Luca Marini maybe just a little behind with the 8-8-6 repartition). In sprints, Johann Zarco had the upper hand. In races, things went more often Luca Marini’s way (helped by the fact that he finished 18 races on Sundays —out of 19 started— compared to Johann Zarco’s 16 and Joan Mir’s 9).
yamaha
monster energy yamaha motogp team
main data
| – | Alex Rins | Fabio Quartararo |
|---|---|---|
| average qualifying position | 15.2 | 5.1 |
| qualifying h2h | 1 | 21 |
| average sprint finishing position | 15.1 | 6.5 |
| sprints h2h | 0 | 17 |
| average race finishing position | 12.9 | 8.7 |
| races h2h | 2 | 14 |
| % of the season completed | 100% | 100% |
| dnfs | 2 | 9 |
| championship points | 68 | 201 |
| championship finish | P19 | P9 |
In 2025, much like in 2024, things in the Yamaha garage were pretty one-sided with Fabio Quartararo remaining ahead of Alex Rins by a margin in all areas.
positions difference
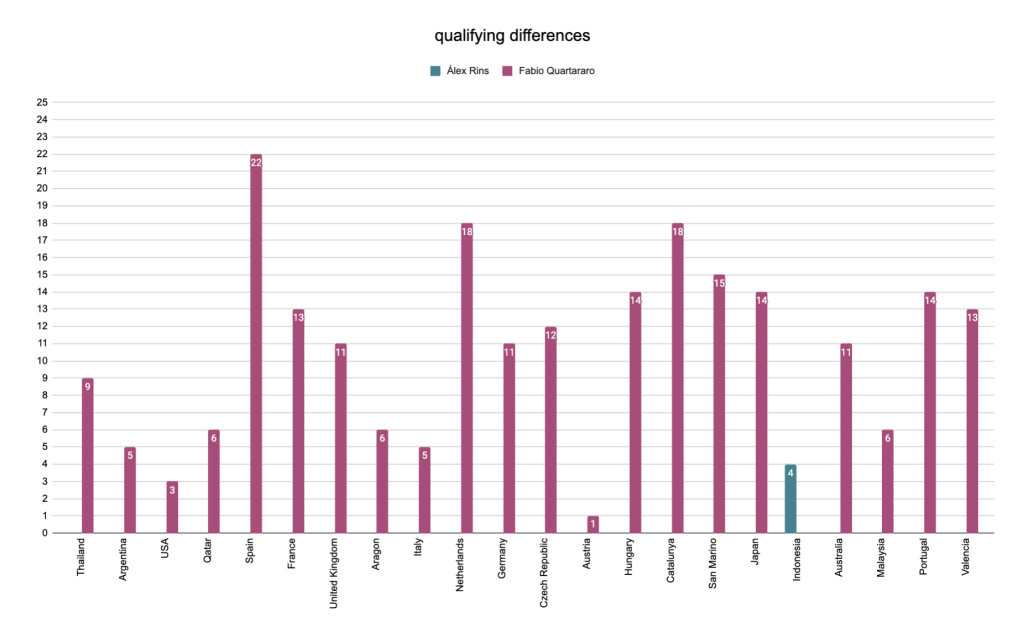
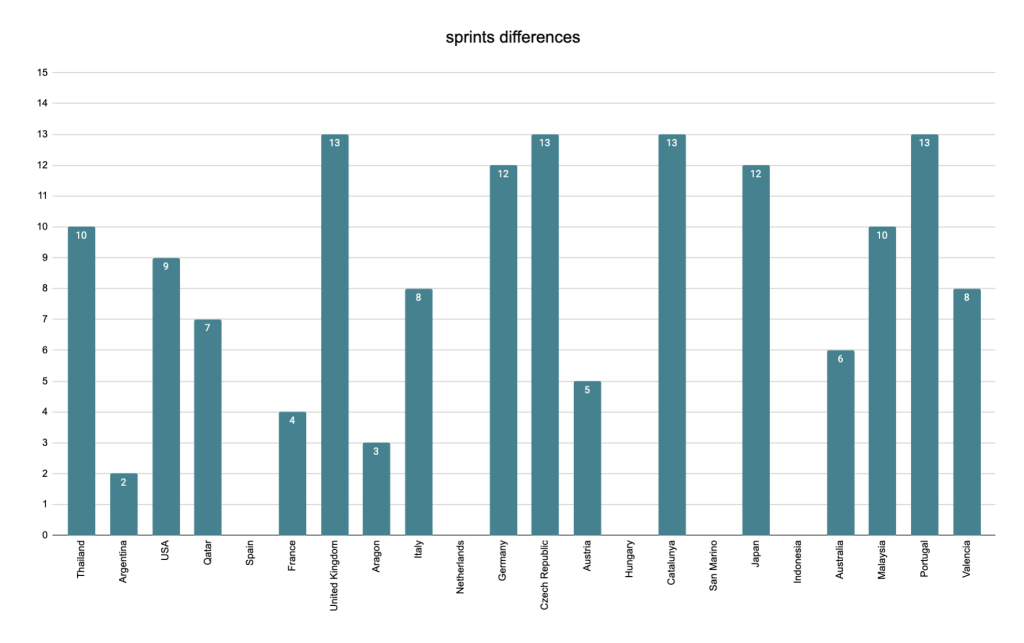
| Session | Alex Rins | Fabio Quartararo |
|---|---|---|
| qualifying | 4.0 | 10.8 |
| sprints | – | 8.7 |
| races | 3.5 | 5.0 |
Fabio’s gaps were bigger in qualifying and sprints but to me, this only attests to his decline on Sundays compared to Saturdays.
The Spaniard only outqualified his teammate once, in Mandalika (Rins P4, Quartararo P8). He outdid the 2021 World champion on Sunday on two occasions :
- Termas : Rins P11 and Quartararo P14 (+3),
- Phillip Island : Rins P7 and Quartararo P11 (+4).
comparison with 2024
To make this easy and put it in a few words : between 2024 and 2025, Alex Rins’ numbers roughly stayed the same (at least in qualifying and sprints, races got a bit better) while Fabio Quartararo’s improved in every regard.
In 2024, the Spaniard could still get ahead of the Frenchman on a handful of occasion (4 qualifying sessions, one sprint, 4 races) but in 2025 the record is much smaller (one qualifying session, 2 races).
Alex Rins did race all of 2025 after missing 3 rounds in 2024 and he improved on Sundays so his championship points did double (31 -> 68) but his position barely moved (P18 -> P19). Fabio Quartararo’s points less than doubled (113 -> 201) but he did gain 4 positions in the standings (P13 -> P9), furthering the gap with his teammate.
prima pramac yamaha motogp
main data
| – | Jack Miller | Miguel Oliveira |
|---|---|---|
| average qualifying position | 11.7 | 16.4 |
| qualifying h2h | 16 | 3 |
| average sprint finishing position | 12.3 | 14.4 |
| sprints h2h | 11 | 4 |
| average race finishing position | 11.7 | 13.5 |
| races h2h | 7 | 4 |
| % of the season completed | 100% | 84% |
| dnfs | 10 | 5 |
| championship points | 79 | 43 |
| championship finish | P17 | P20 |
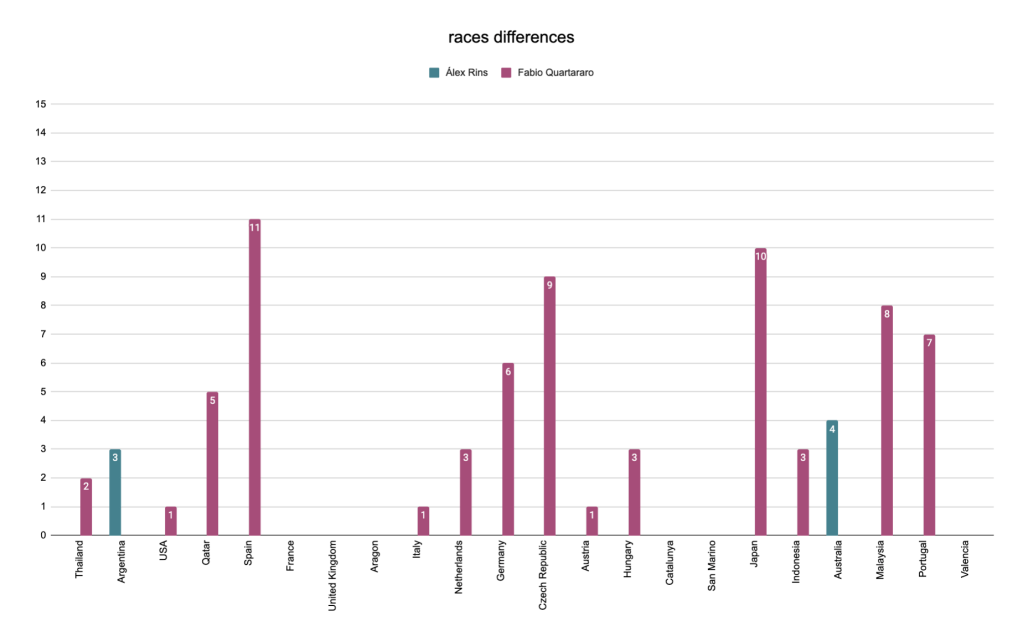
Pramac started the season with a new manufacturer and two riders coming from a 2024 season on a bike from a different factory (KTM for Jack Miller and Aprilia for Miguel Oliveira). If we look straight at the numbers, it seems like the Aussie adapted to the Yamaha better.
The gap is pretty big when it comes to qualifying (whether it comes to the AQP or the H2H) but it slims down when we look at the sprints and races numbers (which ties with Jack Miller losing spots from the grid and Miguel Oliveira staying the same or gaining positions).
We do have to note that once again, Miguel Oliveira’s season was plagued by injuries and he didn’t get to ride it in full or fully healthy when he was there.
positions difference
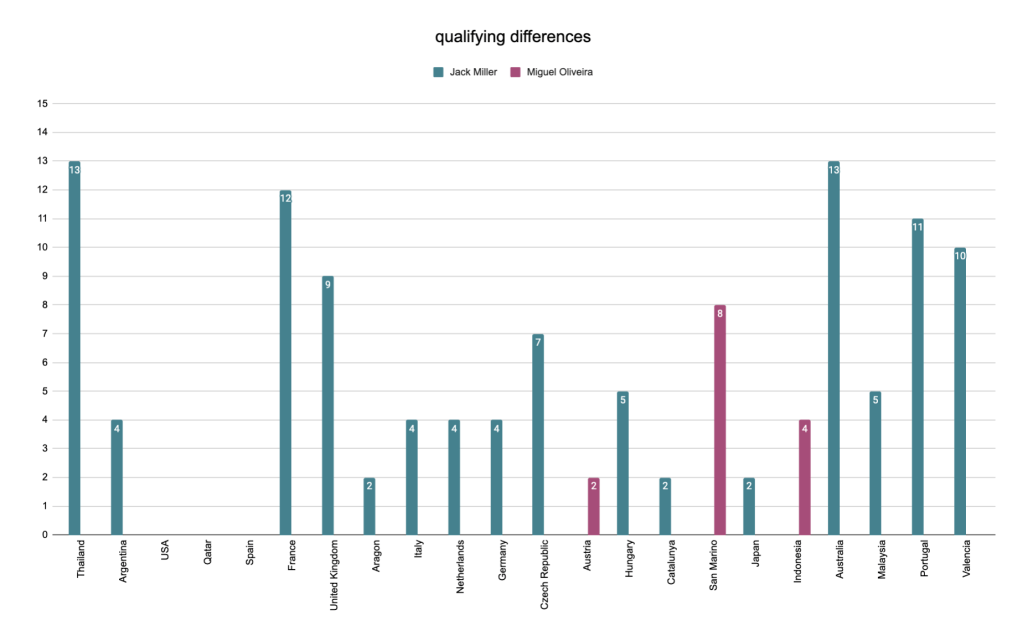

| Session | Jack Miller | Miguel Oliveira |
|---|---|---|
| qualifying | 6.7 | 4.7 |
| sprints | 4.3 | 2.3 |
| races | 4.1 | 3.0 |
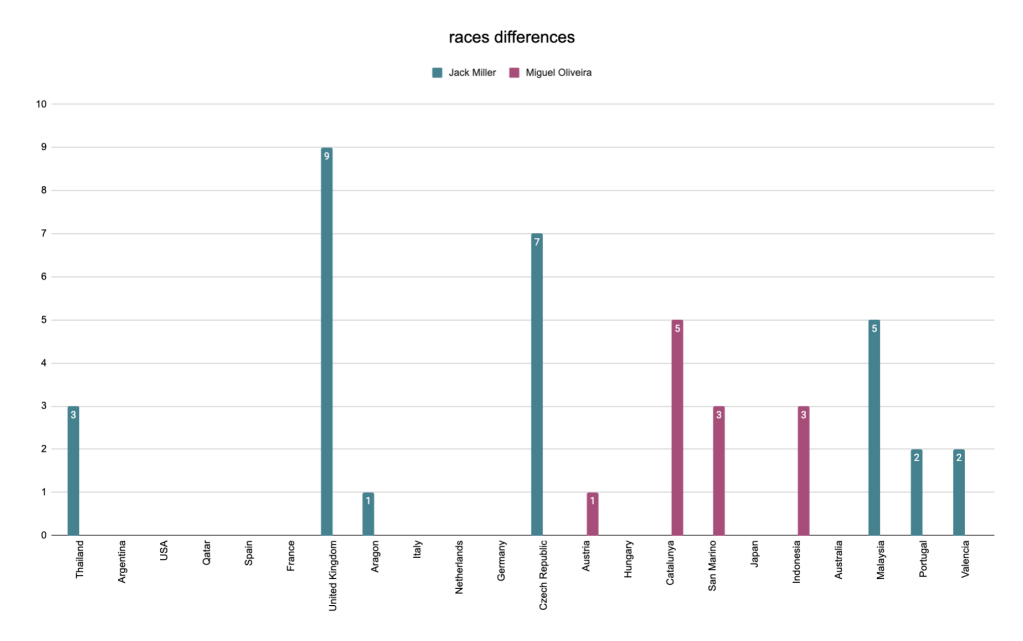
As mentioned above, if the gaps in qualifying tended to be a bit chaotic, the two Pramac riders did manage to stay closer when racing :
- 10 sprints finished 3 or less positions apart and 5 sprints finished 5 or more positions apart,
- 7 races finished 3 or less positions apart and 4 races finished 5 or more positions apart.
The Aussie was more often the man in front, which shows in their H2H numbers and the championship points.
all teams
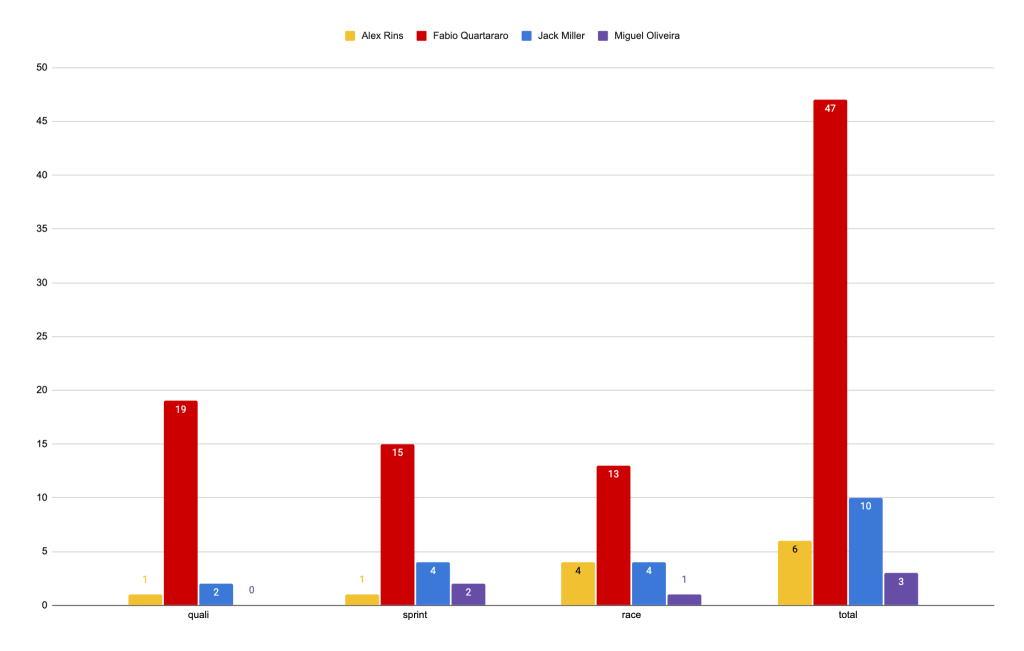
H2H – All Yamaha riders
And we’re back to the classics with one rider well above the rest : Fabio Quartararo in the case of Yamaha. Of all the factories, Yamaha is the one with the biggest difference between its top rider and the rest, the Frenchman having been the best Yamaha rider on 47 occasions out of 66 chances (71% of the time).
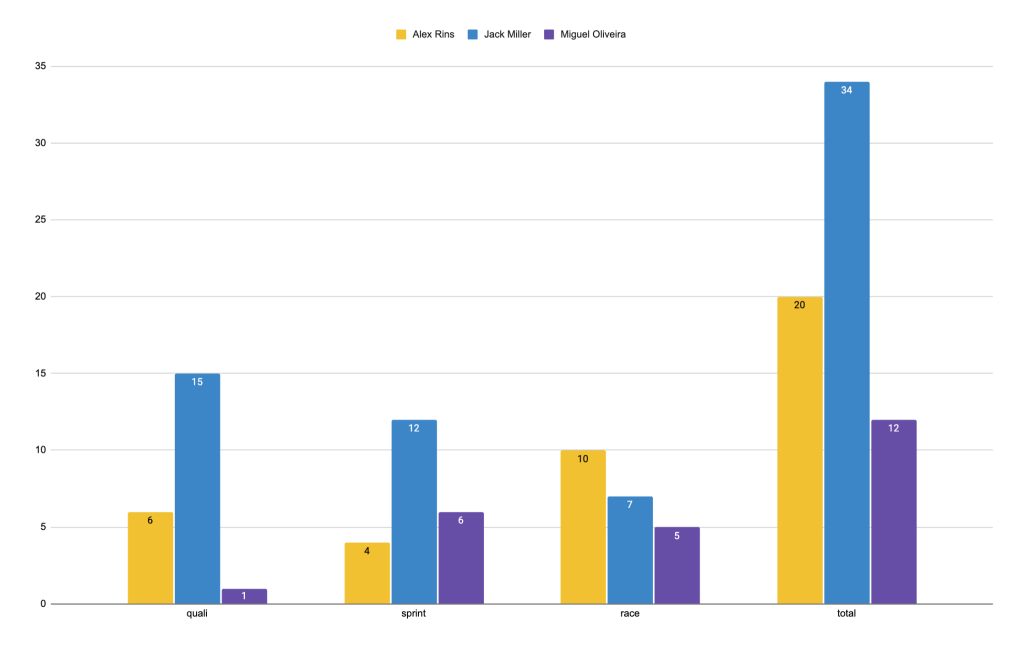
H2H – All Yamaha riders except Fabio Quartararo
Once Fabio Quartararo’s results put aside, Jack Miller has the lead in qualifying and sprints but once Sunday arrives, Alex Rins does better during the longer distance of races. Miguel Oliveira remains behind in all 3 categories.
overall round-up
introduction
I have concatenated all the results presented above in 3 different tables. As mentioned earlier, this only account for qualifying sessions where both teammates participated and sprints/races where both teammates crossed the finish line.
Example of a line in the table and how to read it :
| teammates | difference | number of qualifying sessions |
|---|---|---|
| Fernandez / Ogura | 7.4 | 12 |
This means that in 12 qualifying sessions, Raul Fernandez (first name of the first column) qualified ahead of Ai Ogura (second name of the first column) and, on average, in those qualifying sessions, Raul finished 7.4 positions above Ai.
When looking at the averages, it’s important to keep in mind the number of sessions (qualifying, sprints or races) that have been taken into account. An average that gathered 12 races is obviously more meaningful that one only built on one race or two.
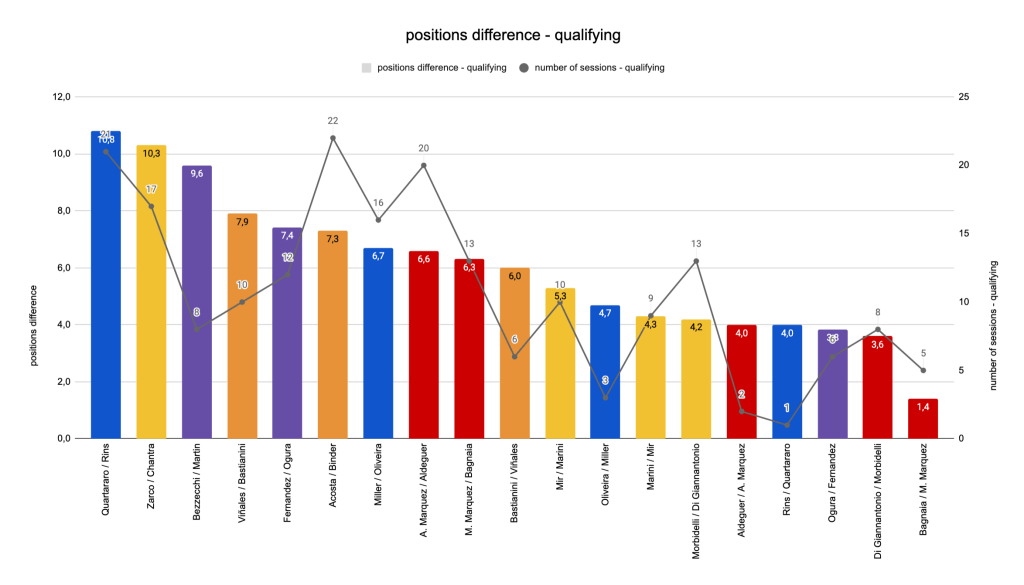
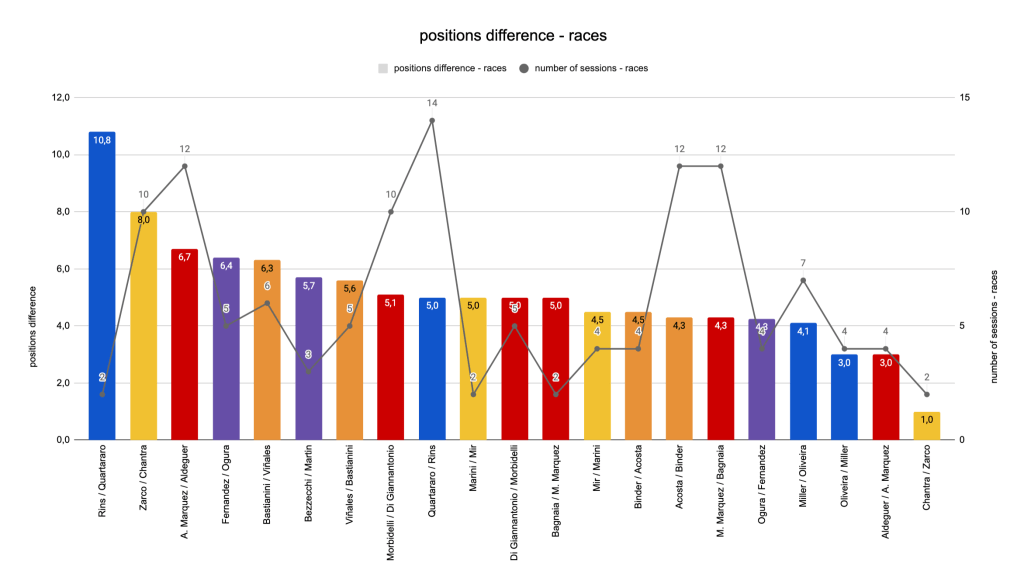
qualifying
| teammates | positions difference – qualifying | number of sessions – qualifying |
|---|---|---|
| Quartararo / Rins | 10.8 | 21 |
| Zarco / Chantra | 10.3 | 17 |
| Bezzecchi / Martin | 9.6 | 8 |
| Viñales / Bastianini | 7.9 | 10 |
| Fernandez / Ogura | 7.4 | 12 |
| Acosta / Binder | 7.3 | 22 |
| Miller / Oliveira | 6.7 | 16 |
| A. Marquez / Aldeguer | 6.6 | 20 |
| M. Marquez / Bagnaia | 6.3 | 13 |
| Bastianini / Viñales | 6.0 | 6 |
| Mir / Marini | 5.3 | 10 |
| Oliveira / Miller | 4.7 | 3 |
| Marini / Mir | 4.3 | 9 |
| Morbidelli / Di Giannantonio | 4.2 | 13 |
| Aldeguer / A. Marquez | 4.0 | 2 |
| Rins / Quartararo | 4.0 | 1 |
| Ogura / Fernandez | 3.8 | 6 |
| Di Giannantonio / Morbidelli | 3.6 | 8 |
| Bagnaia / M. Marquez | 1.4 | 5 |
| Martin / Bezzecchi | – | – |
| Chantra / Zarco | – | – |
| Binder / Acosta | – | – |
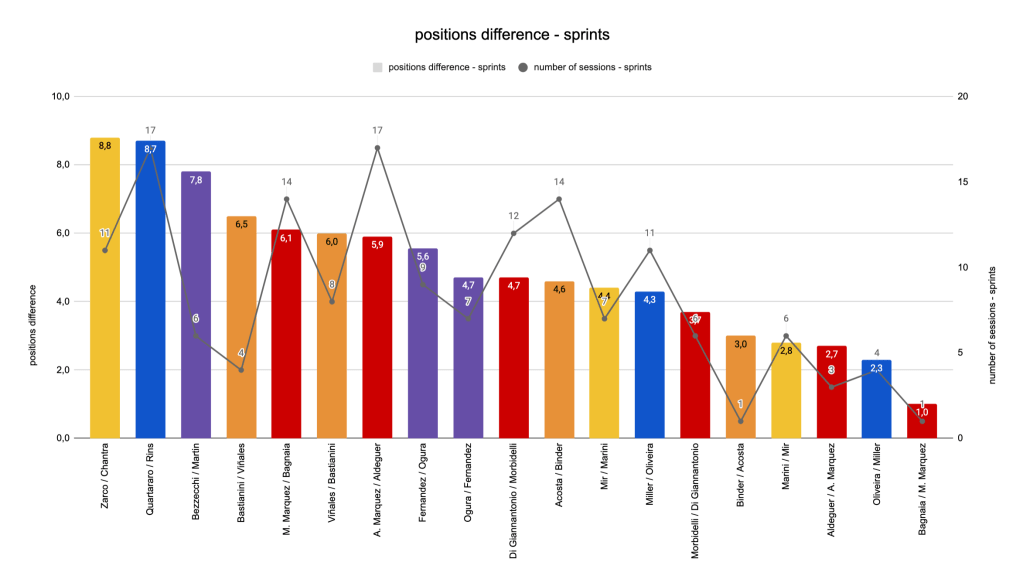
sprints
| teammates | positions difference – sprints | number of sessions – sprints |
|---|---|---|
| Zarco / Chantra | 8.8 | 11 |
| Quartararo / Rins | 8.7 | 17 |
| Bezzecchi / Martin | 7.8 | 6 |
| Bastianini / Viñales | 6.5 | 4 |
| M. Marquez / Bagnaia | 6.1 | 14 |
| Viñales / Bastianini | 6.0 | 8 |
| A. Marquez / Aldeguer | 5.9 | 17 |
| Fernandez / Ogura | 5.6 | 9 |
| Ogura / Fernandez | 4.7 | 7 |
| Di Giannantonio / Morbidelli | 4.7 | 12 |
| Acosta / Binder | 4.6 | 14 |
| Mir / Marini | 4.4 | 7 |
| Miller / Oliveira | 4.3 | 11 |
| Morbidelli / Di Giannantonio | 3.7 | 6 |
| Binder / Acosta | 3.0 | 1 |
| Marini / Mir | 2.8 | 6 |
| Aldeguer / A. Marquez | 2.7 | 3 |
| Oliveira / Miller | 2.3 | 4 |
| Bagnaia / M. Marquez | 1.0 | 1 |
| Rins / Quartararo | – | – |
| Martin / Bezzecchi | – | – |
| Chantra / Zarco | – | – |
races
| teammates | positions difference – races | number of sessions – races |
|---|---|---|
| Rins / Quartararo | 10.8 | 2 |
| Zarco / Chantra | 8.0 | 10 |
| A. Marquez / Aldeguer | 6.7 | 12 |
| Fernandez / Ogura | 6.4 | 5 |
| Bastianini / Viñales | 6.3 | 6 |
| Bezzecchi / Martin | 5.7 | 3 |
| Viñales / Bastianini | 5.6 | 5 |
| Morbidelli / Di Giannantonio | 5.1 | 10 |
| Quartararo / Rins | 5.0 | 14 |
| Marini / Mir | 5.0 | 2 |
| Di Giannantonio / Morbidelli | 5.0 | 5 |
| Bagnaia / M. Marquez | 5.0 | 2 |
| Mir / Marini | 4.5 | 4 |
| Binder / Acosta | 4.5 | 4 |
| Acosta / Binder | 4.3 | 12 |
| M. Marquez / Bagnaia | 4.3 | 12 |
| Ogura / Fernandez | 4.3 | 4 |
| Miller / Oliveira | 4.1 | 7 |
| Oliveira / Miller | 3.0 | 4 |
| Aldeguer / A. Marquez | 3.0 | 4 |
| Chantra / Zarco | 1.0 | 2 |
points difference
One thing to keep in mind with points is that points don’t reflect on the races missed or DNFed by any of the rider. This is why I prefer to make most of my analysis work using the race weekend that riders actually participated in (and finished, for reasons I’ve mentioned before).
For example, we could imagine that the Ducati gap would be wider if Marc Marquez had been able to race in the last 4 rounds of the season and obviously the Aprilia gap wouldn’t be so huge if we only looked at the race weekends that Jorge Martin participated in.
Those gaps do tell the story of the season if you go looking for it (reverse thinking : why is the Bezzecchi/Martin gap so big? (in part) because of the Martin injuries) so here is why I’m still offering the numbers in this section.
(Everyone keeps that in mind while I consider looking into points per sprint/race started and/or finished for next season. Thank you.)
| Team | Rider 1 | Rider 1 – Points | Rider 2 | Rider 2 – Points | Points Difference | % of points Rider 1 has on Rider 2 |
|---|---|---|---|---|---|---|
| Aprilia | Marco Bezzecchi | 353 | Jorge Martin | 24 | 329 | 1371% |
| Ducati | Marc Marquez | 545 | Pecco Bagnaia | 288 | 257 | 89% |
| Gresini | Álex Marquez | 467 | Fermin Aldeguer | 214 | 253 | 118% |
| Honda | Luca Marini | 142 | Joan Mir | 96 | 46 | 48% |
| KTM | Pedro Acosta | 307 | Brad Binder | 155 | 152 | 98% |
| LCR | Johann Zarco | 148 | Somkiat Chantra | 7 | 141 | 2014% |
| Pramac | Jack Miller | 79 | Miguel Oliveira | 43 | 36 | 84% |
| Tech3 | Enea Bastianini | 112 | Maverick Viñales | 72 | 40 | 56% |
| Trackhouse | Raúl Fernández | 172 | Ai Ogura | 89 | 83 | 93% |
| VR46 | Fabio Di Giannantonio | 262 | Franco Morbidelli | 231 | 31 | 13% |
| Yamaha | Fabio Quartararo | 201 | Álex Rins | 68 | 133 | 196% |
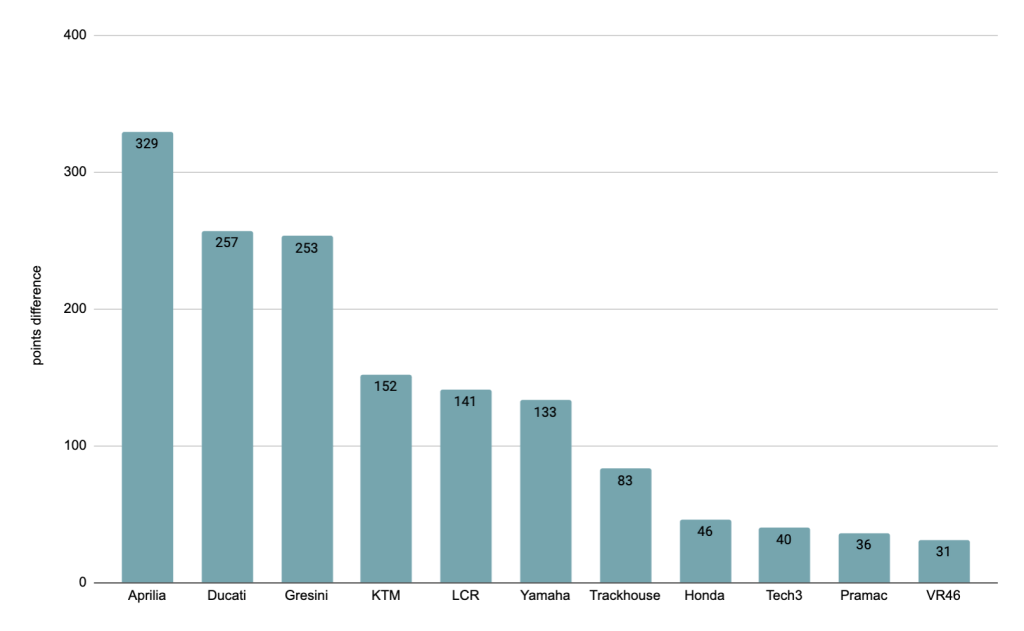
Points differences in the championship standings between teammates – All teams
On one side, the biggest difference is observed for 3 very different cases :
- Aprilia with Marco Bezzecchi performing and Jorge Martin barely racing in 2025,
- Ducati with Marc Marquez dominating the season and Pecco Bagnaia scoring some podiums but struggling too much to catch up,
- Gresini with Alex Marquez having his greatest MotoGP season in a fashion so high it puts him far from Fermin Aldeguer despite Fermin’s solid rookie season.
On the other side, we can find 4 teams where both teammates ended up separated by less than 46 points (around 2 points per round) : VR46, Pramac, Tech3 and Honda.
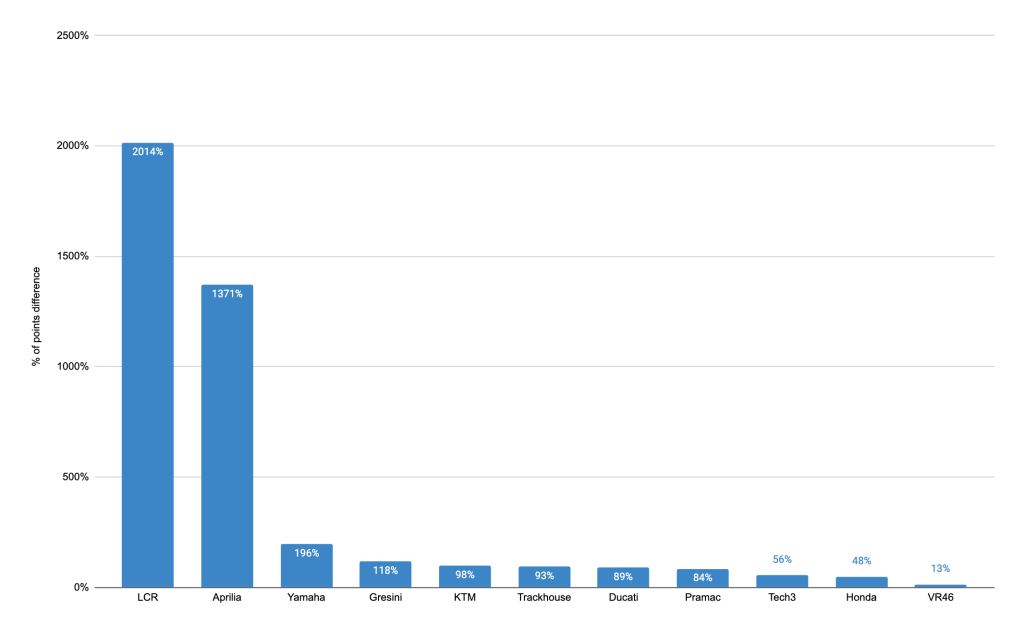
% of points difference in the championship standings between teammates – All teams
If Ducati was 2nd in the points difference, they fall 7th in the % chart. This is simply because while Marc Marquez scored an enormous amount of points (the new record in a season), Pecco Bagnaia didn’t fully crash down and still managed to score a decent amount of points as well.
As evidenced earlier in the article, LCR Honda with Johann Zarco and Somkiat Chantra and Aprilia with Marco Bezzecchi and Jorge Martin are in a world of their own in terms of teammates scoring a widely different amount of points.
If we put them aside to be able to read the rest of the chart more properly, we get this :
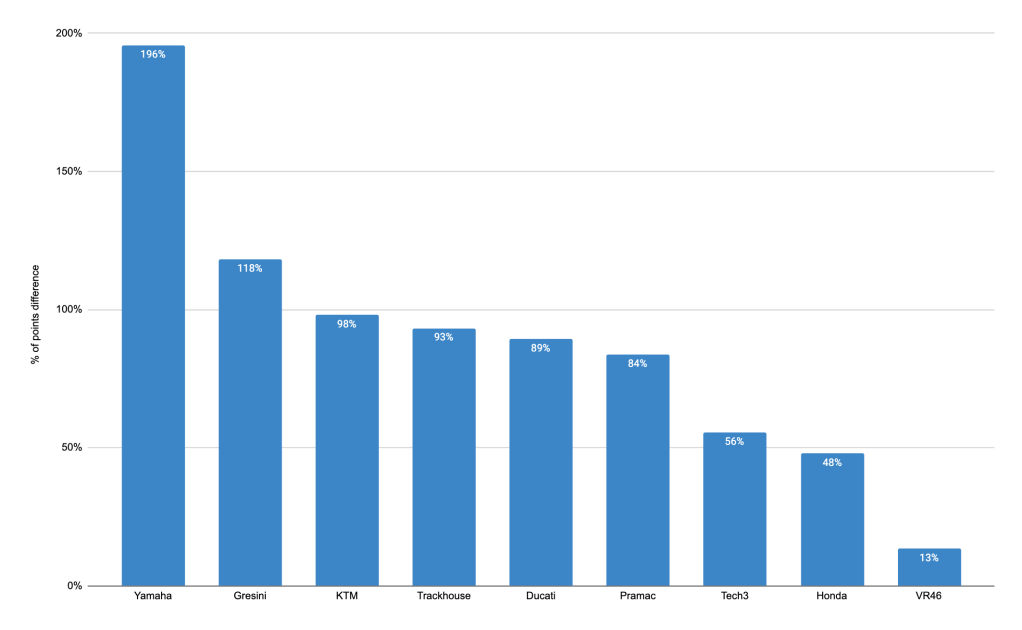
% of points difference in the championship standings between teammates – All teams minus LCR and Aprilia
We get a more homogenous distribution, with Yamaha on one extreme and VR46 on the other.
This chart allows us to see that in terms of relativeness, as things stood at the end of 2025, the gap between Marc Marquez and Pecco Bagnaia was the same as the one between Jack Miller and Miguel Oliveira or Raul Fernandez and Ai Ogura.

![[MOTOGP – RESULTS] : A study of the 2025 season DNFs](https://virageduraccordement.com/wp-content/uploads/2026/02/54765052116_df71230554_o.jpg?w=1024)
![[MOTOGP – SURVEYS] : People’s opinion on the 2025 season](https://virageduraccordement.com/wp-content/uploads/2025/12/img_5076.jpg?w=1024)
![[MOTOGP – RESULTS] : An overall look at the 2025 season](https://virageduraccordement.com/wp-content/uploads/2025/11/54816173937_898f5574e6_o.jpg?w=1024)
![[MOTOGP – RESULTS] : A check-up on the first 12 rounds of the 2025 season](https://virageduraccordement.com/wp-content/uploads/2025/07/54354125374_f3762ae206_o.jpg?w=1024)
![[MOTOGP – STUDIES] : Valentino Rossi and his performances by circuit (1996-2021)](https://virageduraccordement.com/wp-content/uploads/2025/05/12437219663_ebd575951a_o.jpg?w=1024)

Laisser un commentaire